Visitor map widget
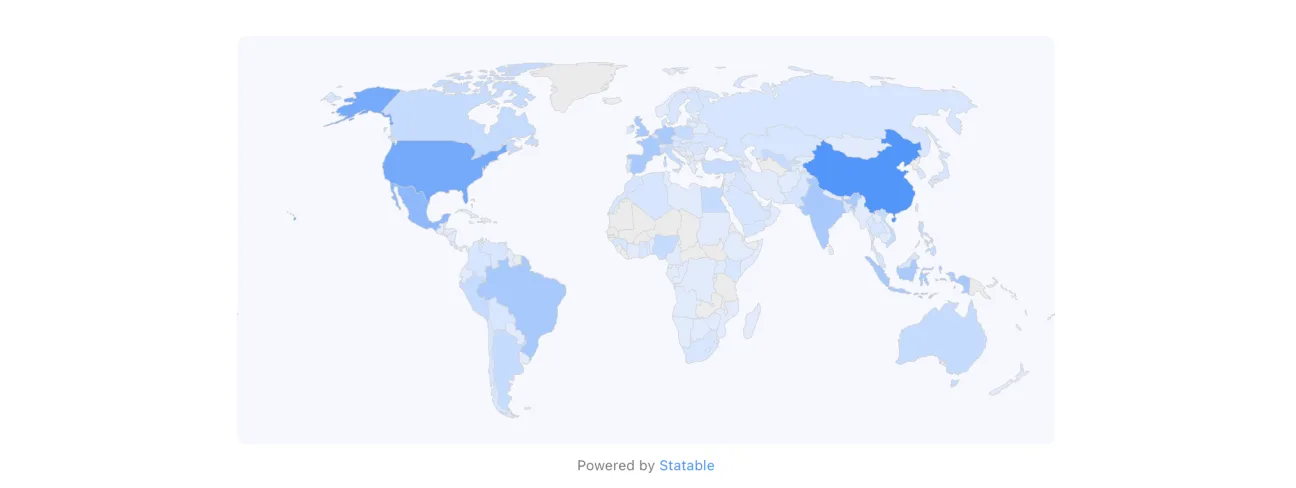
A flat world map shaded by visitor location. Two modes: country shading (heatmap) or city dots. Fits anywhere a <div> fits.
When to use it
- Marketing / landing pages: visual proof of reach
- Office TVs / dashboards: looks good at any size
- Conference talks: quick "look how global this is" visual
- Product status pages: pair with system-status indicators
Quick install
Don't copy the snippet from this page. The real one lives in Site settings → Widget → Map, with data-hash already filled in and a one-click copy button.
Options
| Attribute | Values | Default | Notes |
|---|---|---|---|
data-hash | your public hash | (required) | |
data-theme | light / dark / auto | auto | |
data-period | 1d / 7d / 30d / 90d | 7d | Time window |
data-display-mode | heatmap / cities | heatmap | Country shading vs city dots |
data-primary-color | hex | #0093FF | Country fill (heatmap) or dot colour (cities) |
data-ocean-color | hex | #3B82F60D light / #262626 dark | Background colour for water |
data-outer-radius | 0 / 8 / 16 / 32 | 8 | Border radius (px) of the widget container |
data-show-stats | true / false | true | Pageview count and date range, above the map |
data-stats-text-color | hex | #51677A | Colour of that pageview line |
data-width | pixels | 640 | |
data-height | pixels | 320 |
The map loads its data once, when the page loads. Reload the page for fresh numbers.
Two modes
Heatmap mode (default)
Countries are filled with data-primary-color, with opacity proportional to visitor share. The country with the most visitors is fully saturated; everything else fades.
<script defer
  src="https://statable.com/js/mw.js"
  data-hash="03D3Cfb9eA"
  data-display-mode="heatmap">
</script>
Cities mode
Individual cities are rendered as dots, sized by visitor count. Best on a wider canvas (≥600 px) so the dots don't crowd.
<script defer
  src="https://statable.com/js/mw.js"
  data-hash="03D3Cfb9eA"
  data-display-mode="cities"
  data-width="800"
  data-height="400">
</script>
More examples
Dark theme, rounded corners, custom ocean colour:
<script defer
  src="https://statable.com/js/mw.js"
  data-hash="03D3Cfb9eA"
  data-theme="dark"
  data-outer-radius="16"
  data-primary-color="#10B981"
  data-ocean-color="#0F172A">
</script>
Compact card layout, fixed 480 × 240 px:
<div class="map-card">
  <script defer
    src="https://statable.com/js/mw.js"
    data-hash="03D3Cfb9eA"
    data-width="480"
    data-height="240"
    data-outer-radius="8">
  </script>
</div>
30-day window with city dots, brand-aligned colours:
<script defer
  src="https://statable.com/js/mw.js"
  data-hash="03D3Cfb9eA"
  data-period="30d"
  data-display-mode="cities"
  data-primary-color="#FF5722">
</script>
What the visitor sees
- A line above the map with the pageview count and the date range, e.g.
1,204 PageviewsoverJul 11 - Jul 17. Hide it withdata-show-stats="false" - Hover any country (heatmap mode): tooltip with country name and visitor count
- Hover any city dot: tooltip with city, country, visitor count
- Countries and dots fade in as the map draws, instead of jumping into place
Notes
- Map projection: Natural Earth. Balanced for global data, doesn't exaggerate Greenland or Antarctica.
- City data: up to 100 most-active cities in cities mode. Smaller cities aggregate into their country's heatmap.
- Bundle size: about 5.3 KB over the wire (14 KB unpacked).
- Map data: the world atlas is fetched separately (~38 KB compressed) the first time, then served from the browser cache.
See also: Live Users · Top Countries · 3D Globe · Public dashboard & sharing