Statable Debugger
Official browser extension for Chrome, Edge, and Firefox that checks whether the Statable tracking script is correctly installed on the current page. It opens in the side panel on Chrome and Edge, and in the sidebar on Firefox, showing the detected configuration, installation warnings, and a live log of analytics events, without opening DevTools.
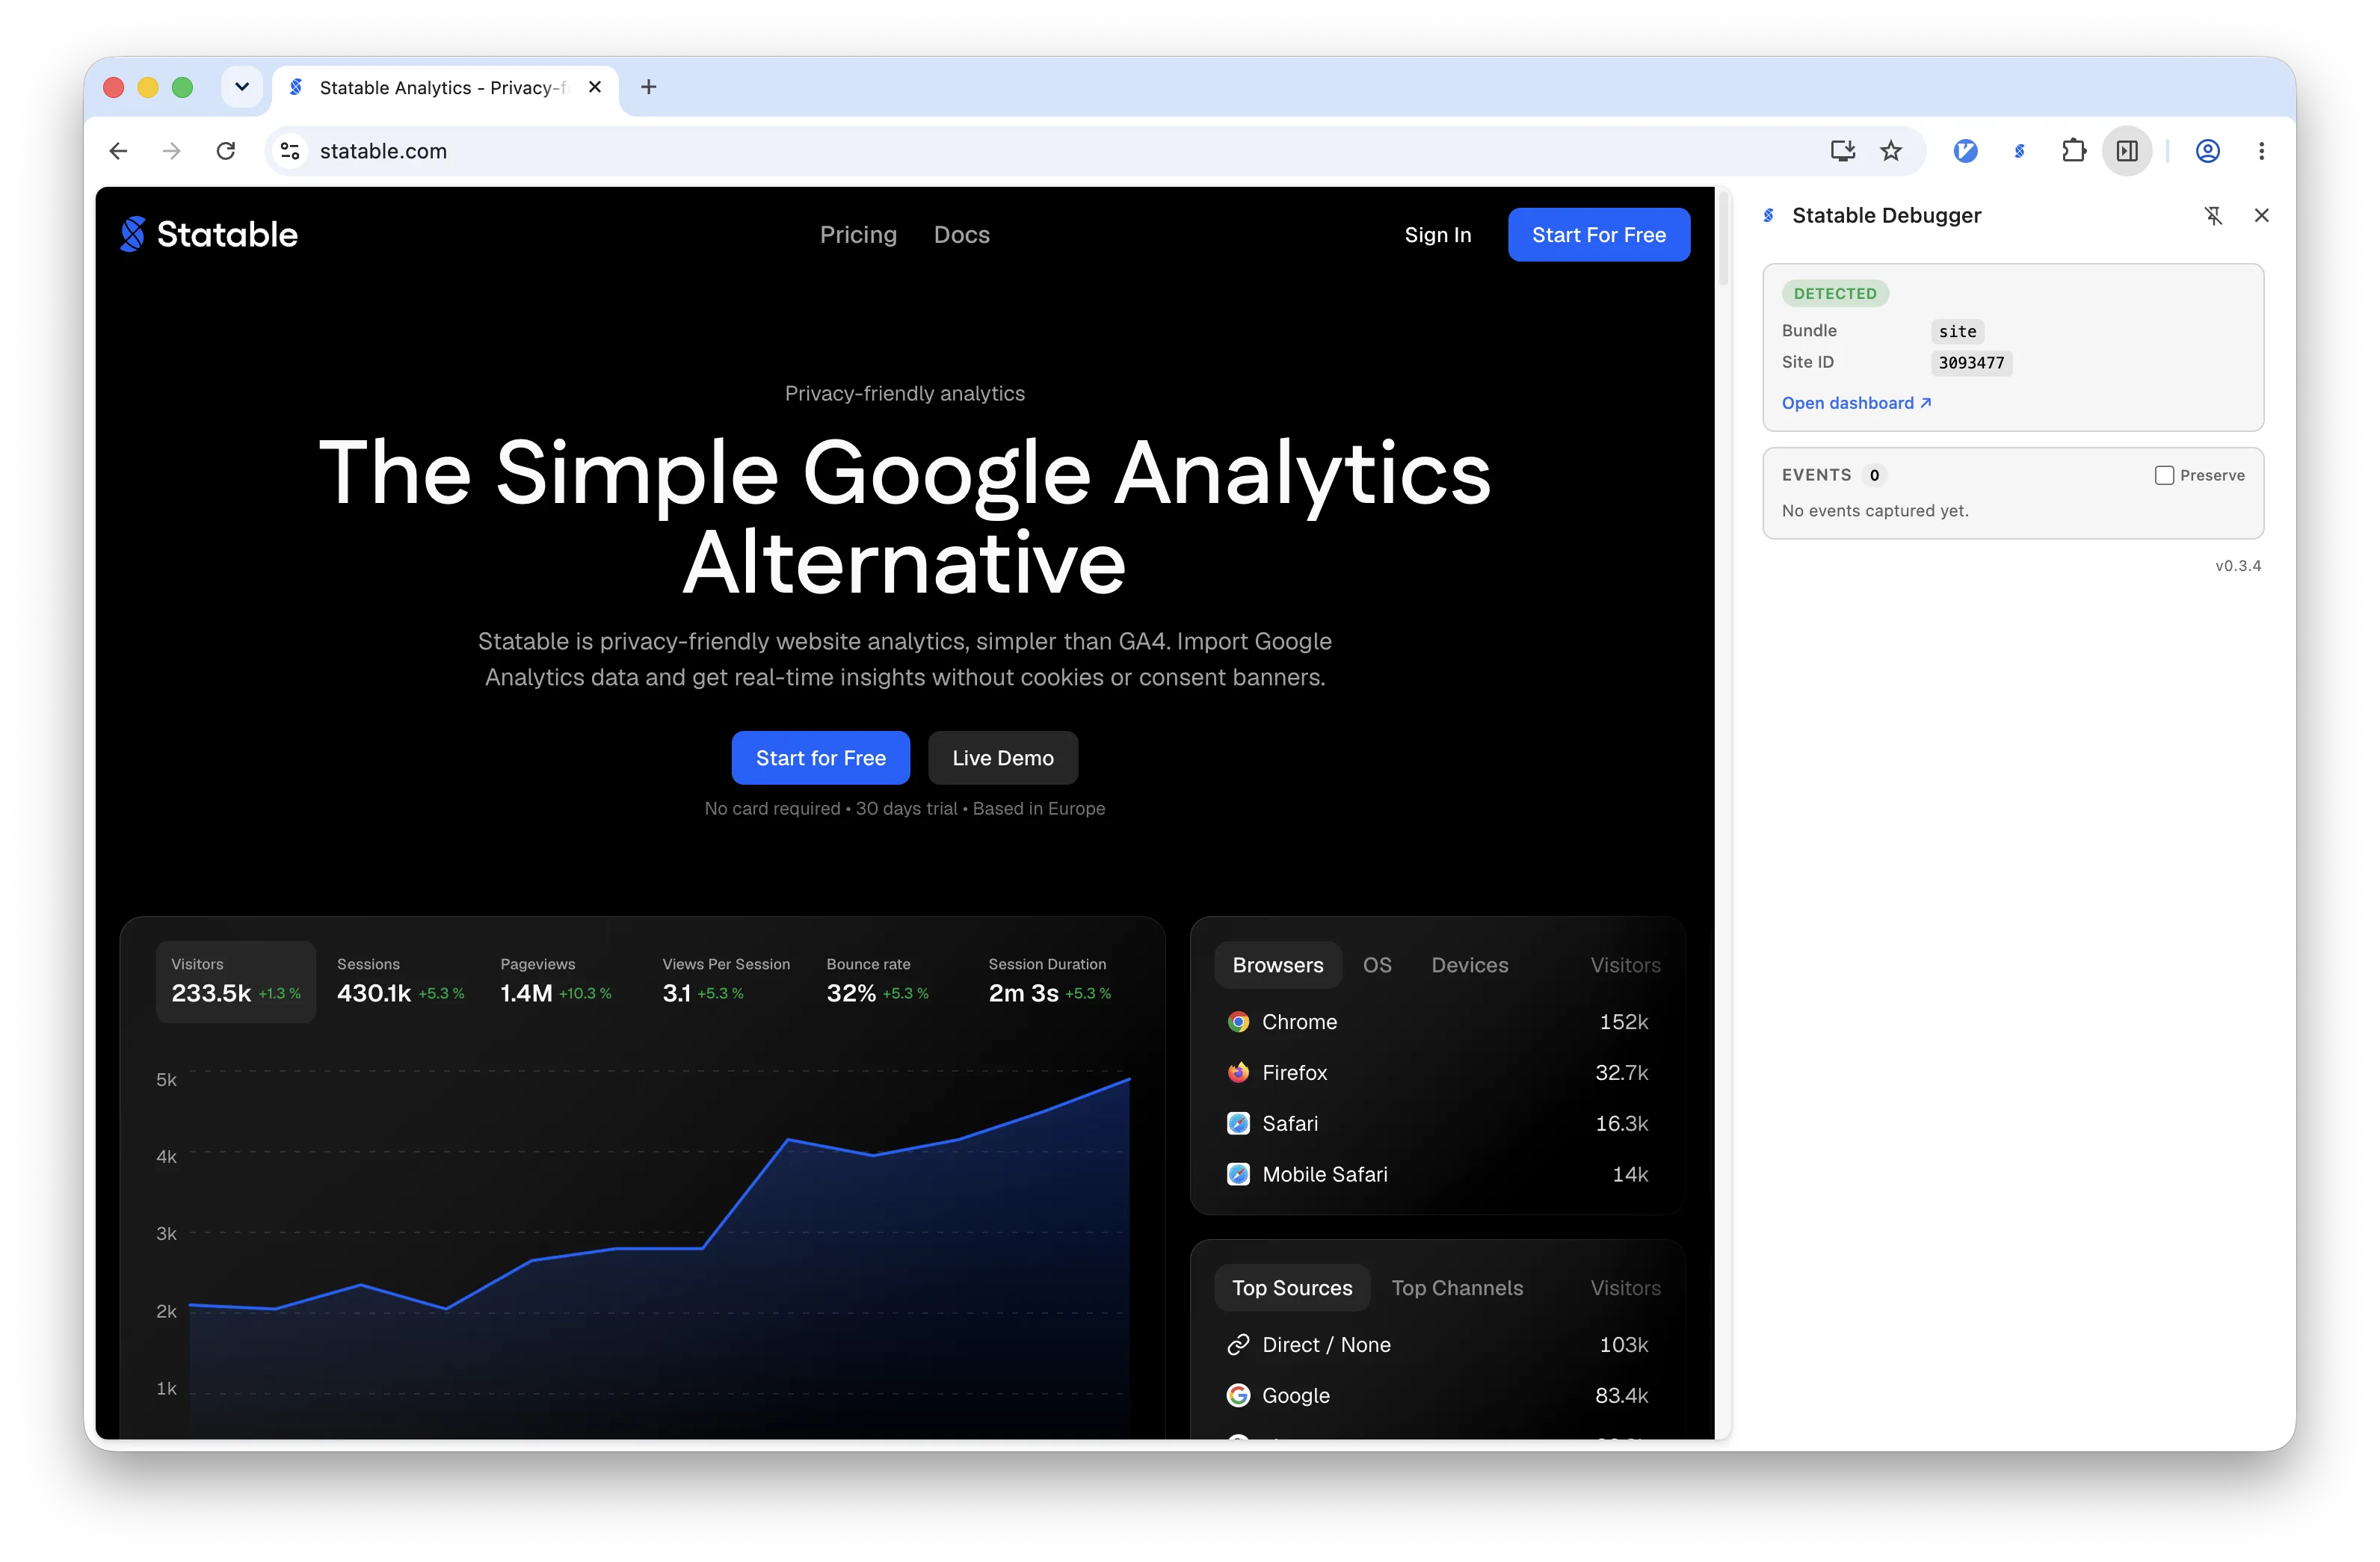
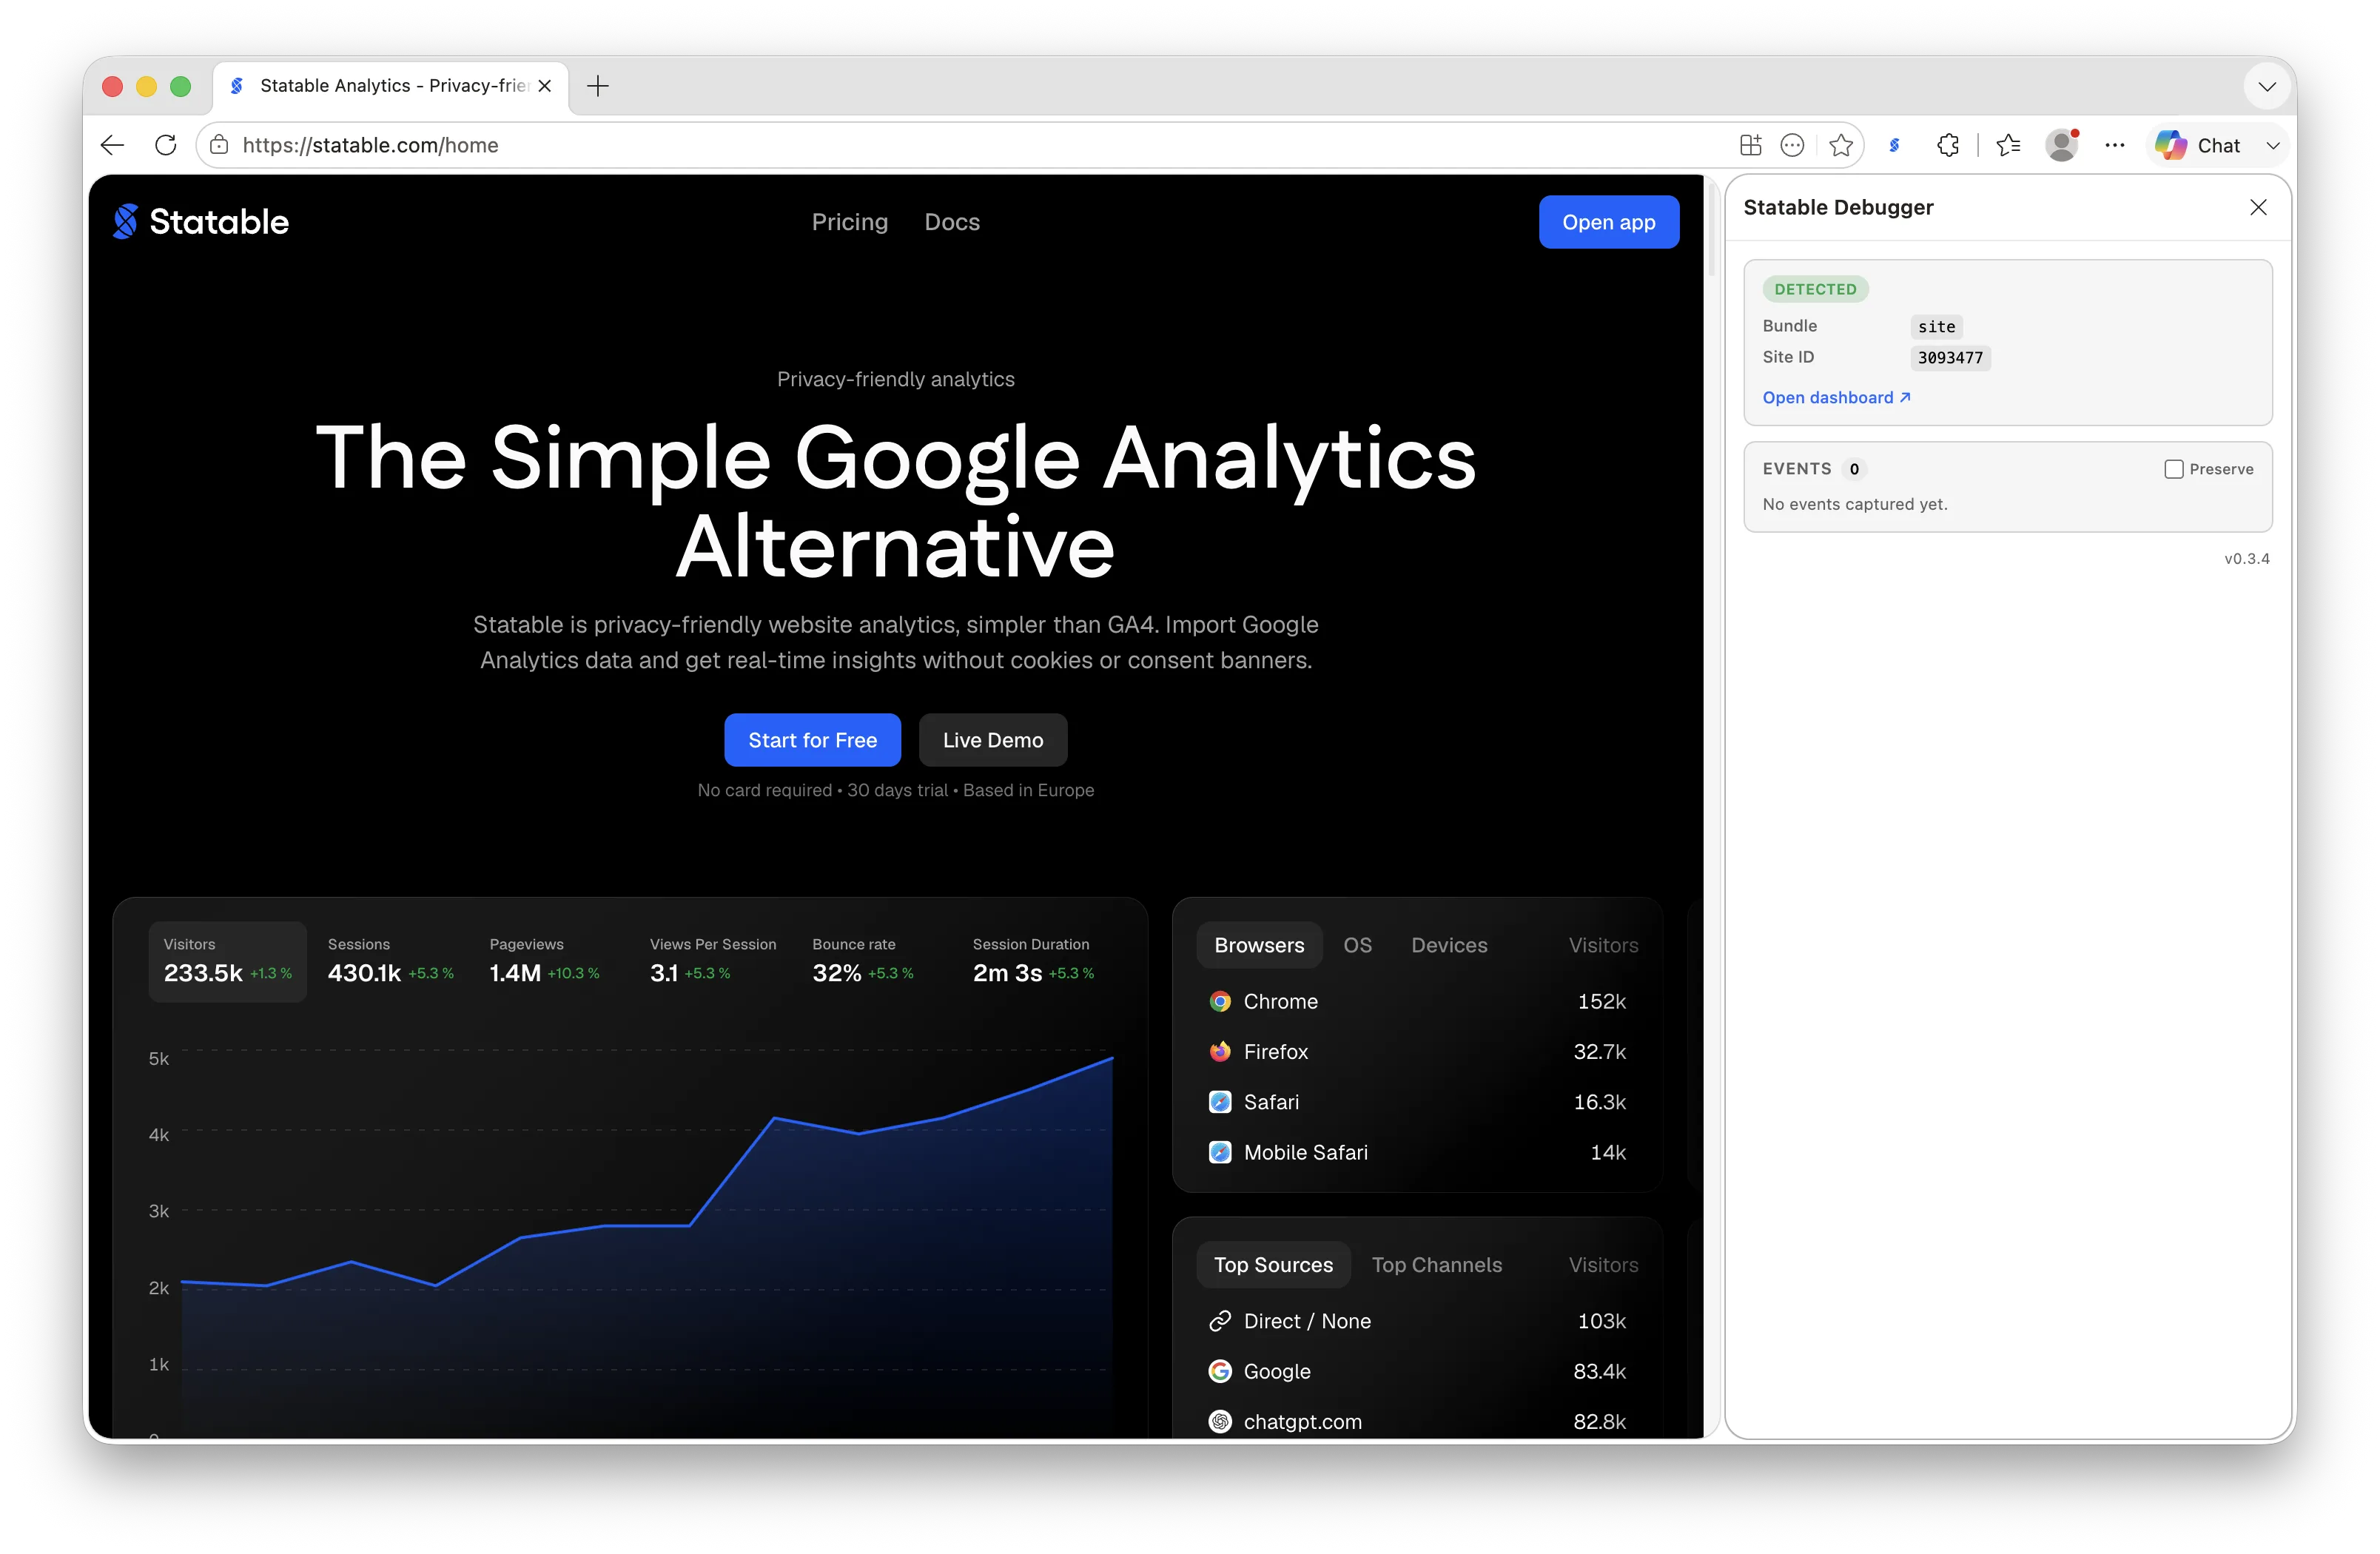
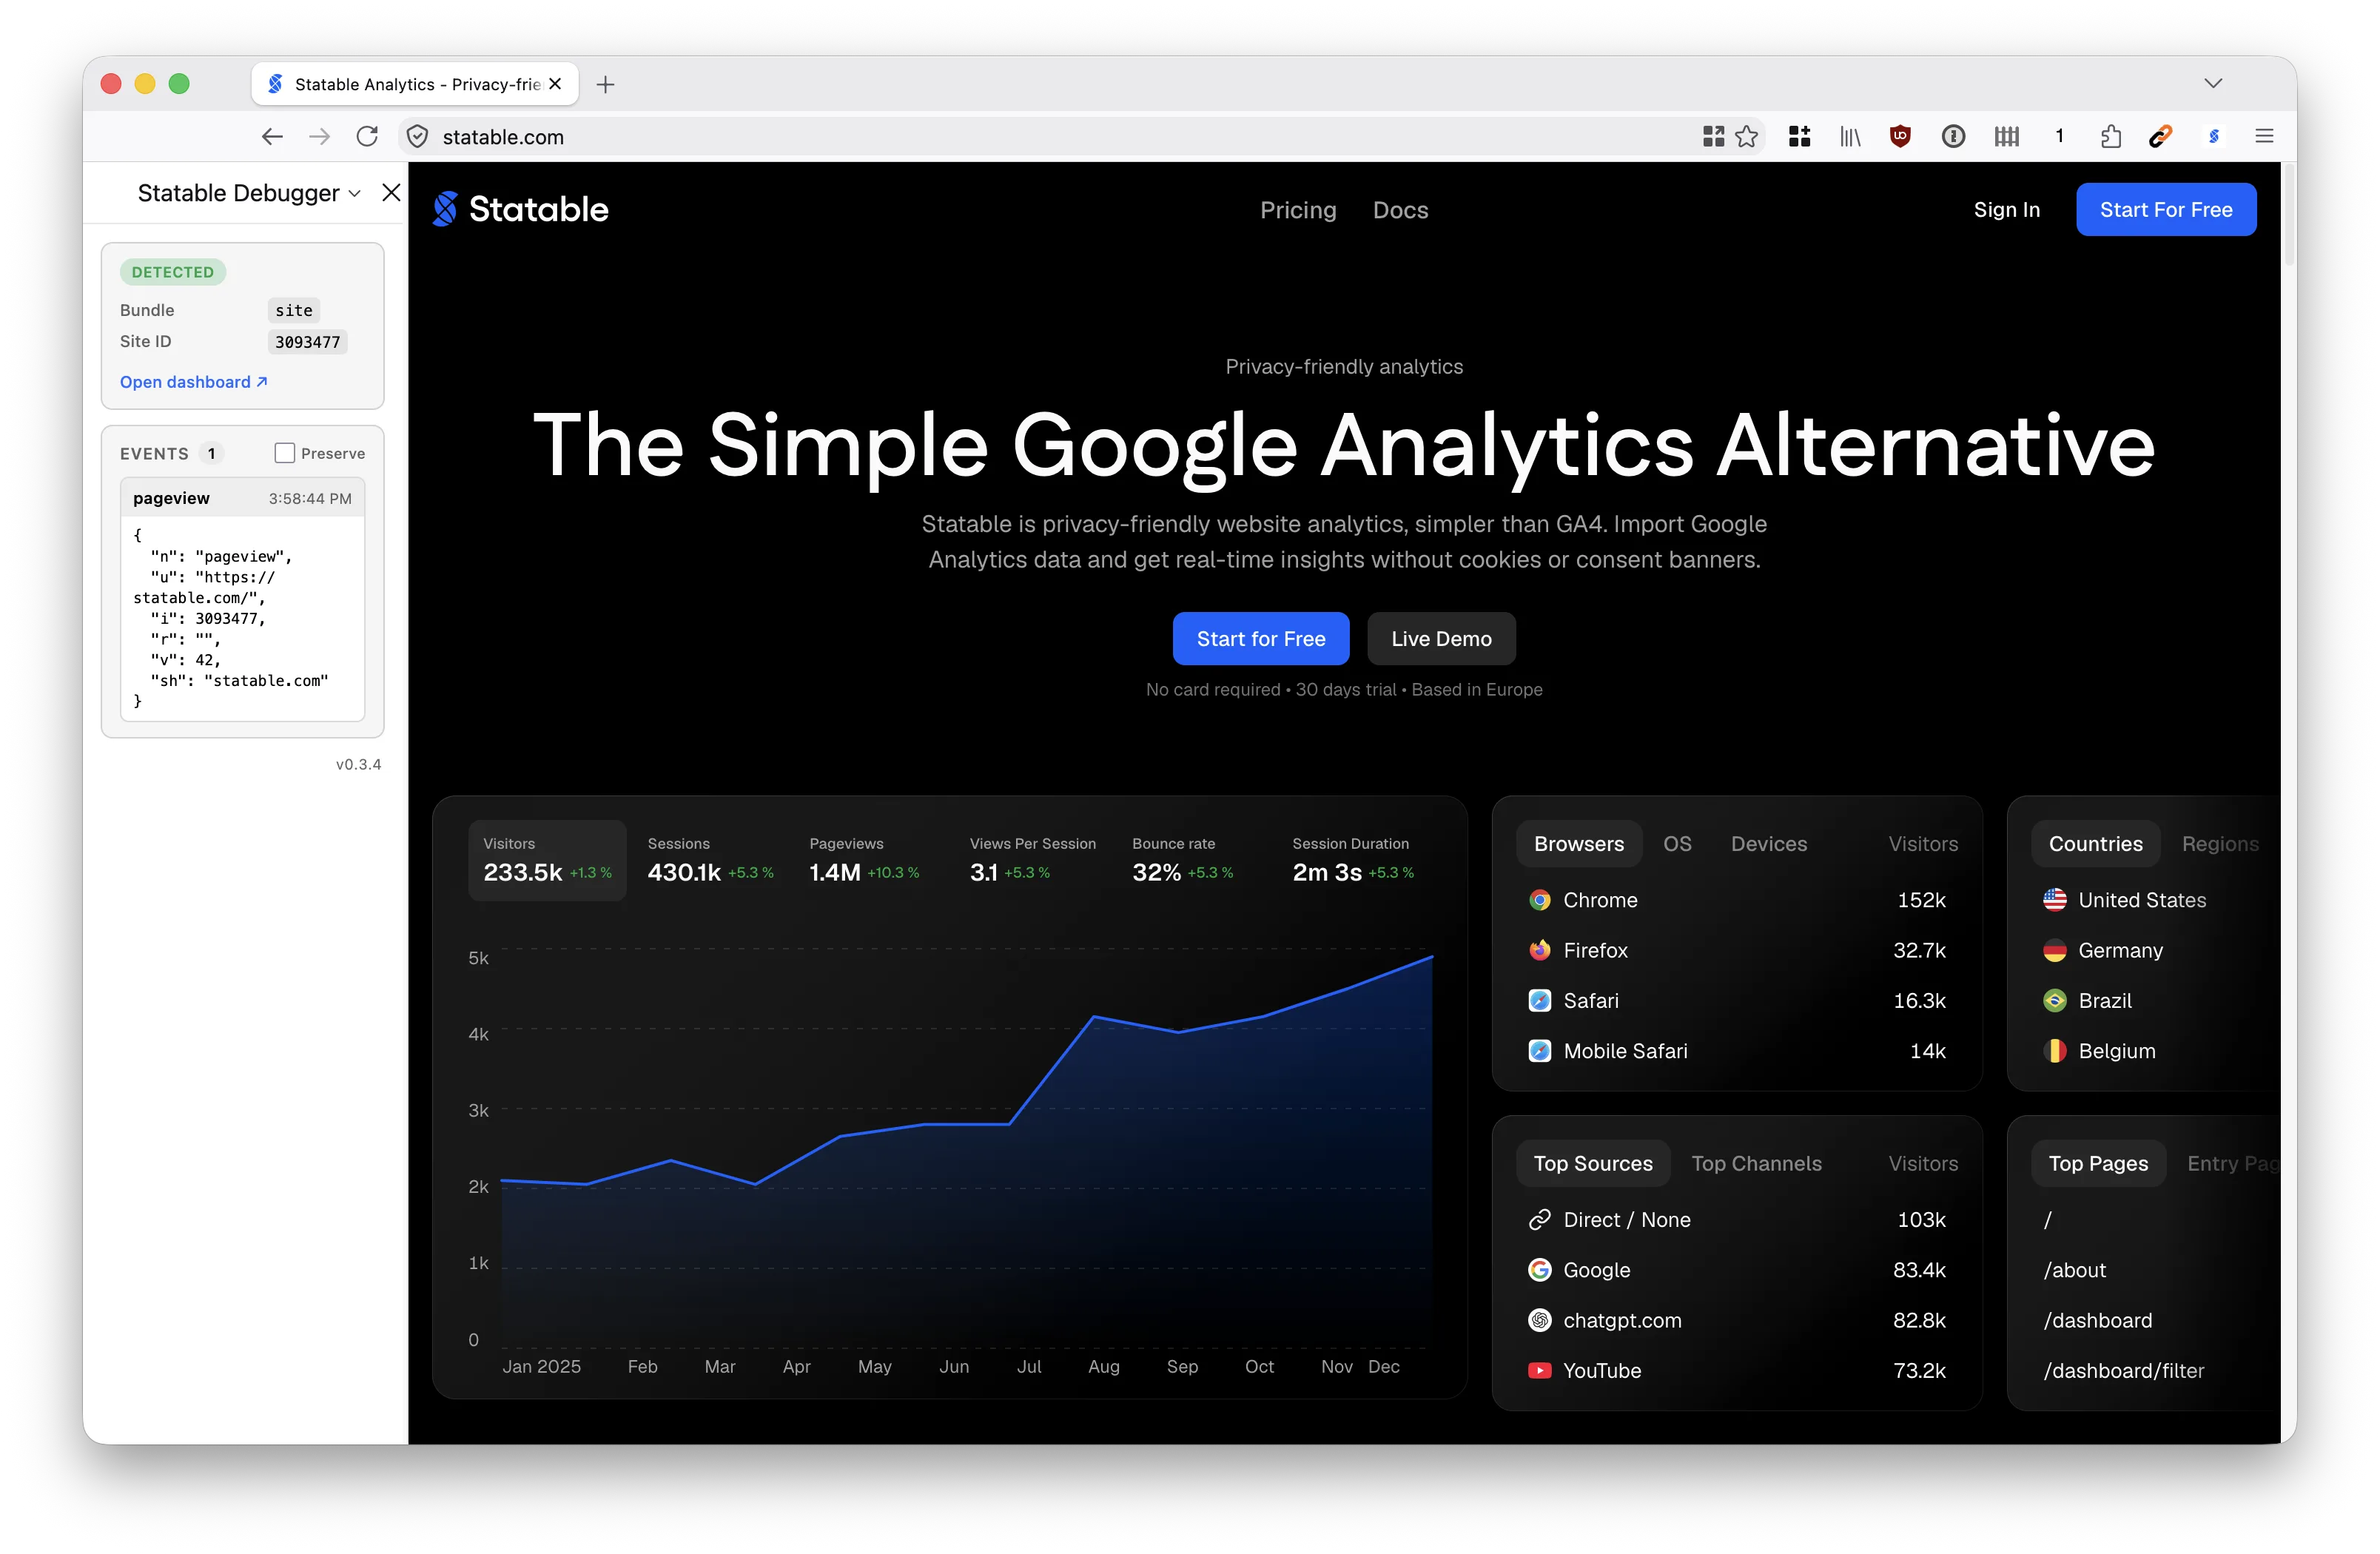
Built for site owners verifying a new install and for developers debugging tracking on staging or production.
Browser support
Statable Debugger has its own listing for Chrome, Edge, and Firefox. Other Chromium browsers (Brave, Arc, Opera) can install the Chrome build too.
Install
Install Statable Debugger for your browser:
- Chrome: Chrome Web Store. Other Chromium browsers (Brave, Arc, Opera) can use this build as well.
- Microsoft Edge: Edge Add-ons.
- Firefox: Firefox Add-ons.
Once installed, pin the extension so its icon stays visible in the toolbar. Click the icon to open the debugger in the side panel on Chrome and Edge, or the sidebar on Firefox.
Stays open beside the page
The side panel (Chrome, Edge) or sidebar (Firefox) stays open while you interact with the page, and follows the active tab. Switch tabs and it re-checks the new page. On browser pages like chrome://, edge://, or about: it shows an unsupported message, since no site runs there.
Detection card
The top card reports whether Statable is present on the page.
- Status:
DetectedorNot detected. - Bundle: the installed script —
site(the current per-site bundle,/js/<id>/s.js), a widget bundle, or legacycount/analytics. Ahobbybadge marks hobby-tier installs. - Site ID: read from the script URL path on current installs (
/js/<id>/s.jscarries no attributes), or from thedata-idattribute on hobby and legacy embeds. - Hash: the site hash, from the
data-hashattribute or from a widget bundle URL (/js/<hash>/...). - Tracking API: the custom endpoint from
data-tracking-api, shown only when a proxy is configured. - beforeSend: the
data-before-sendhook name, when set. - Open dashboard: a link to the site in your Statable dashboard, shown when a Site ID is detected.
Warnings
Below the detection card, the debugger runs eight checks and surfaces anything that would stop events from being recorded. Each warning is marked error, warning, or info.
| Check | Level | Meaning |
|---|---|---|
| Missing Site ID | Error | No site id could be read from the script URL or data-id. Events are sent with i:0. |
| Hobby hostname mismatch | Error | A hobby-tier site is running on a domain that is not whitelisted. The server rejects its events. |
| Tracker not executed | Error | The script tag is present but never ran. An ad blocker or a Content Security Policy is likely blocking it. |
| Opt-out flag set | Warning | localStorage.analytics_ignore is true, so tracking is disabled in this browser. |
| Automated browser | Warning | Webdriver or Cypress was detected. The tracker disables itself in automated sessions. |
| Global Privacy Control | Info | The browser sent a GPC signal. The visitor has opted out. |
| Do Not Track | Info | The browser sent a DNT signal. The visitor has opted out. |
| Self-hosted origin | Info | The script is served from a non-statable.com origin (proxied or self-hosted). |
Errors mean events are not being recorded and need a fix. Info items are expected on your own browser if you run privacy tooling. They do not affect real visitors.
Live event log
The log lists analytics events as the page sends them: pageview, heartbeat engagement pings, and any custom events by name.
Each entry shows the event name, a timestamp, and the full JSON payload. Field meanings are in the Event payload reference.
- Up to 100 events are kept per tab. The 50 most recent are shown, newest first.
- By default the log clears on navigation and when the tab closes. The log is held in memory only, so after a long quiet period it may restart from the current moment — the detection card refills automatically.
- The Preserve toggle in the Events header keeps the log across in-page navigations, off by default. Preserved events stay in memory only and clear when the tab closes.
- Events are captured as the page fires them, including calls sent through a
data-tracking-apiproxy.
When to expect a heartbeat
Heartbeats are not periodic pings. The tracker sends one when the tab is hidden (switching tabs or minimizing — vis: 0) and when it becomes visible again within the same session (vis: 1). A page that stays visible and idle sends nothing — that is expected. If the tab stays hidden for about 28 minutes, the session is closed with a final engagement event, and the next return starts a new one with a fresh pageview.
Privacy
Statable Debugger processes everything locally in your browser. It makes no analytics or telemetry requests of its own, and it sends no page data anywhere. The event log is read from the requests your page already makes.
Full details: extension privacy policy.
Troubleshooting
Not detected on a page that has the script. The script tag may be missing from the rendered HTML, or the bundle URL may be non-standard. Confirm the <script src="...statable.com/js/..."> tag is present in the page source. See Verify your installation.
Tracker not executed warning. Disable ad blockers for the site, or check the page's Content Security Policy. Both can stop the script from running even when the tag is present.
Events do not appear. Check the warnings. A localStorage.analytics_ignore opt-out, an automated browser, or a privacy signal (GPC, DNT) all stop events silently. Clear the flag or test in a clean browser profile.
Ready to take control of your web analytics? Try Statable free for 30 days. No credit card required, full feature access, built for GDPR. Start your free trial or view a live demo.