Dashboard overview
The dashboard is where every metric, report, and filter for your site lives. Once the tracking script is installed, traffic shows up within seconds.
This page is a tour of the layout. Deeper guides cover Top stats, Reports, Filters & segmentation, and Date ranges & Compare.
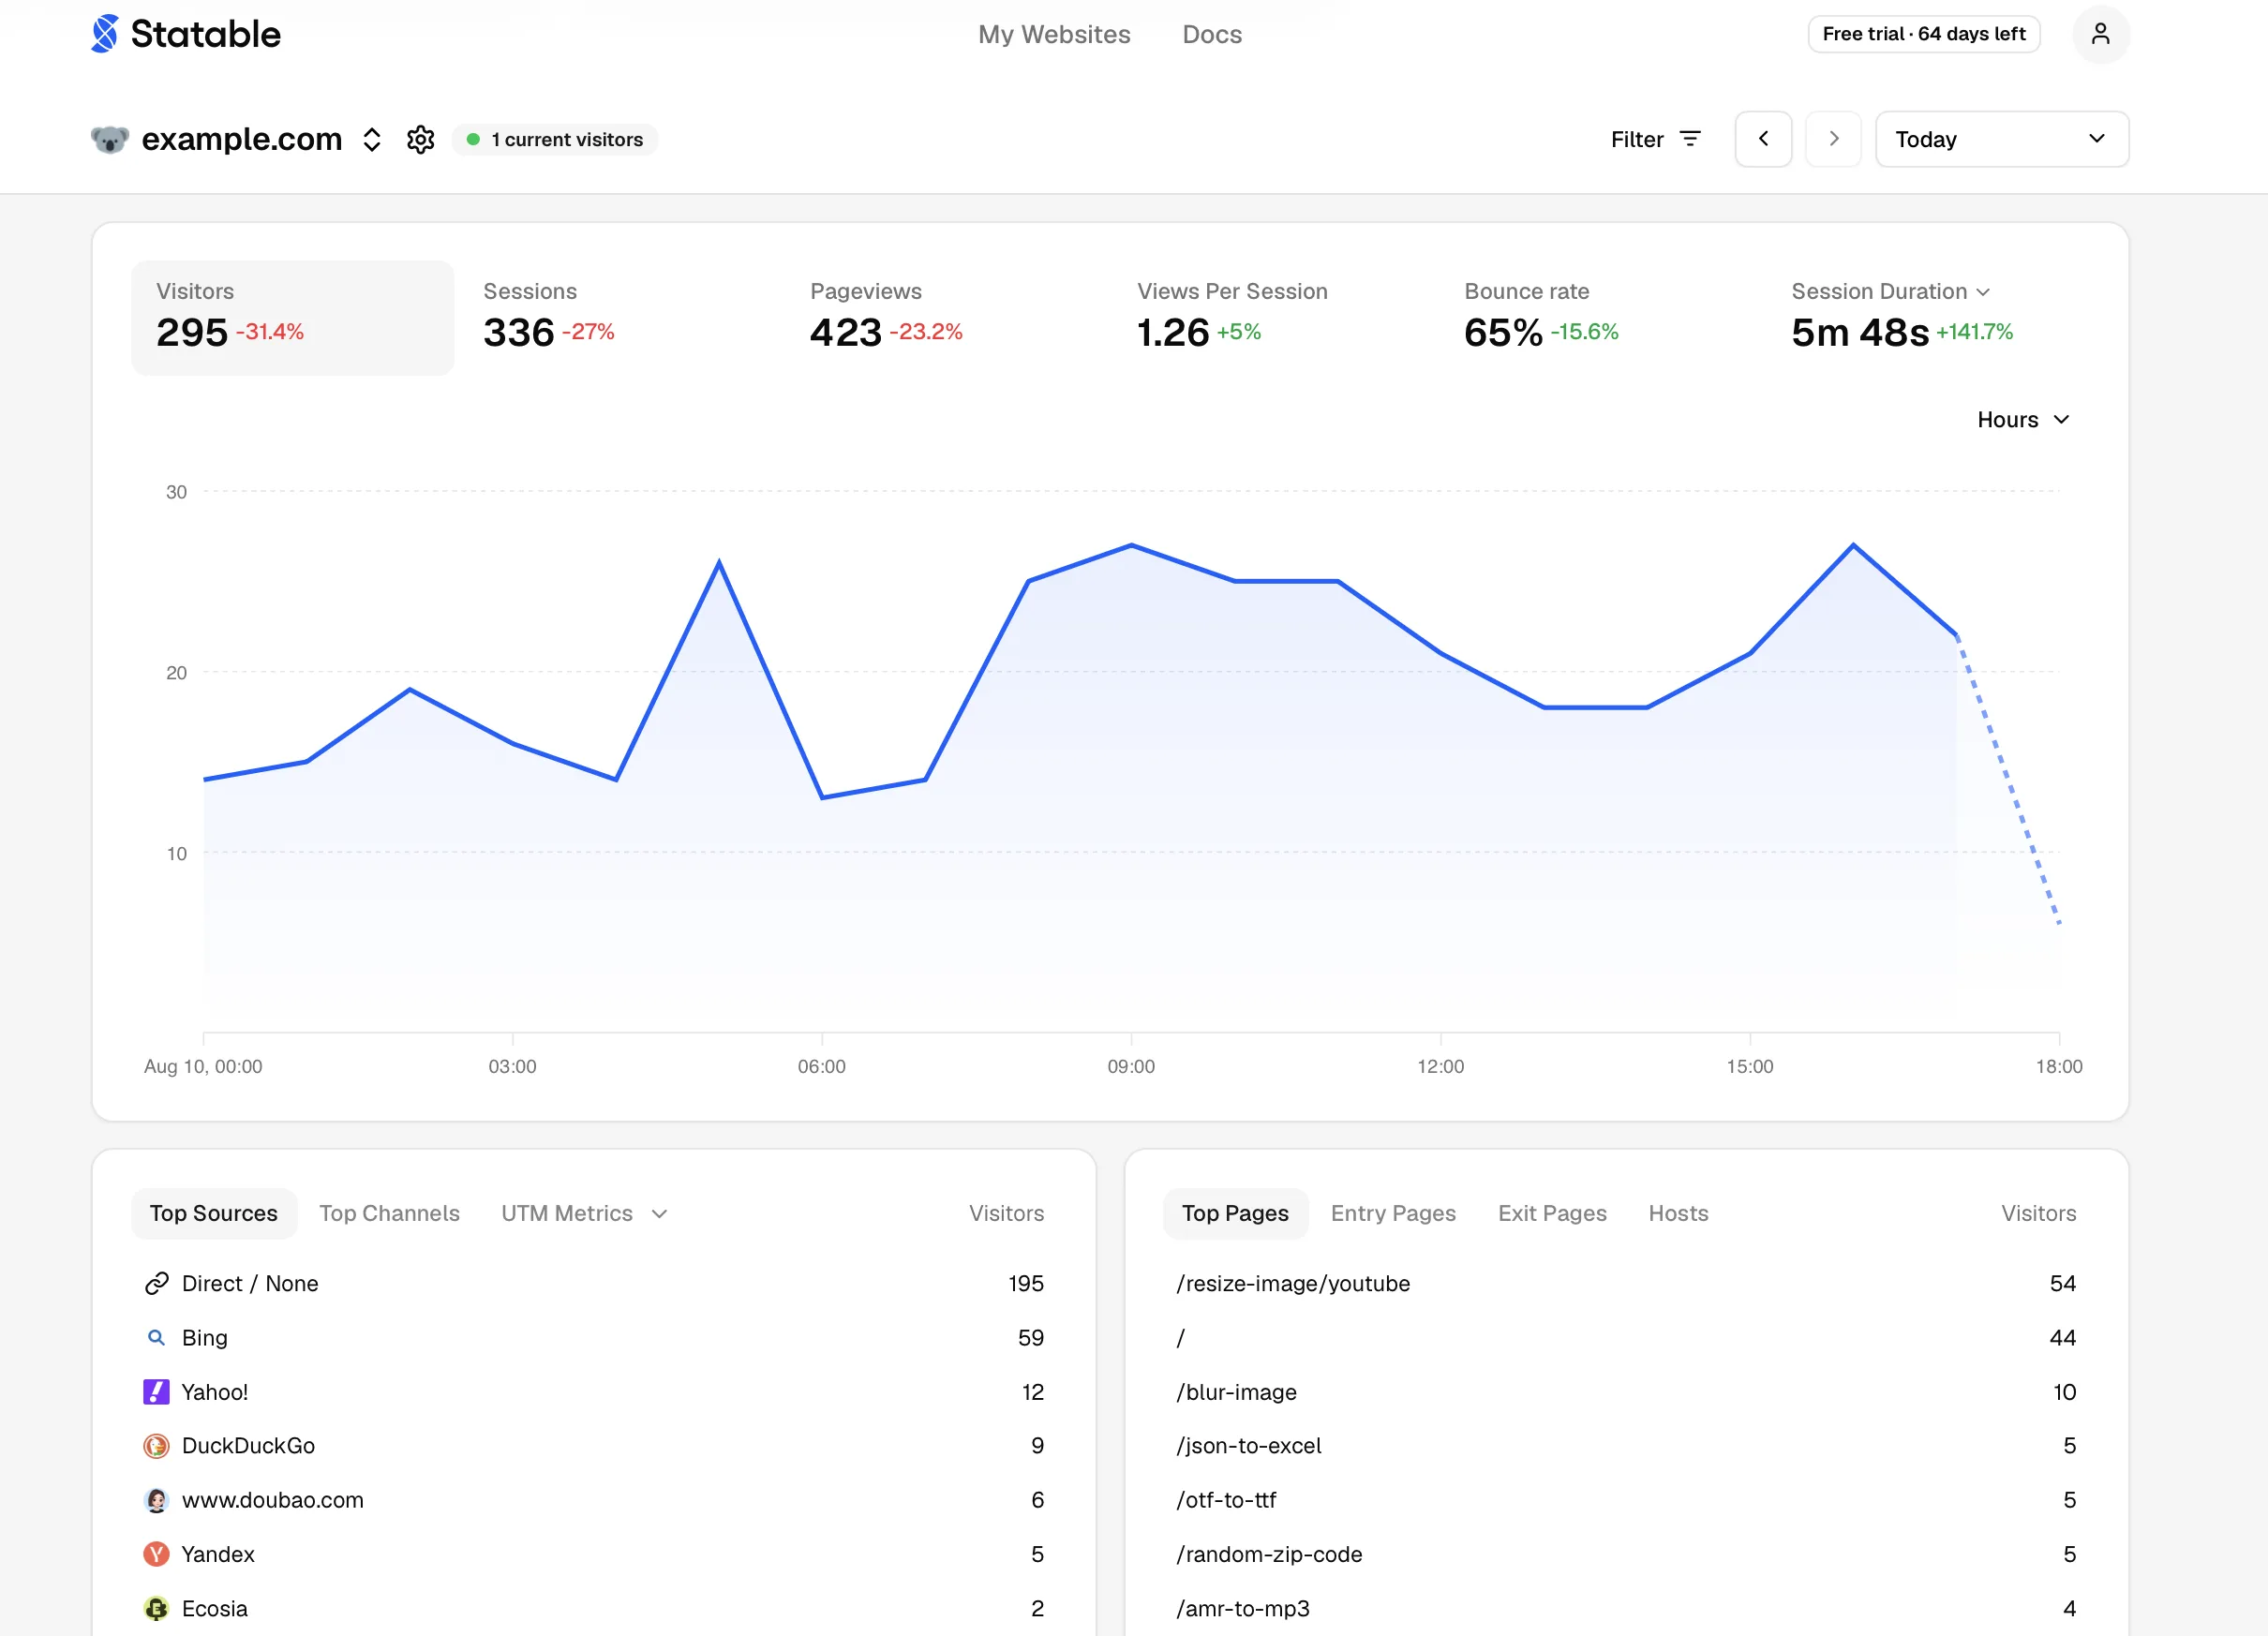
Layout
Four horizontal regions, top to bottom:
- Top navigation. Logo, site switcher, date range picker, and a Current visitors badge. Click the badge to jump into Realtime.
- KPI cards. Seven metrics: Visitors, Sessions, Pageviews, Views Per Session, Bounce Rate, Session Duration, Engagement Time. Each card shows a value and a trend versus the previous period. In Realtime only the first three appear, suffixed with
(Last 30m). - Main chart. Line/area chart of the active KPI. Hover for tooltips. Timeframe selector (hourly, daily, weekly, monthly) sits in the top-right.
- Report cards. Traffic Sources, Page Insights, Tech Insights, Geo Analytics in a two-column grid, with Custom Analytics spanning the full width below. Each card has its own tabs for individual reports.
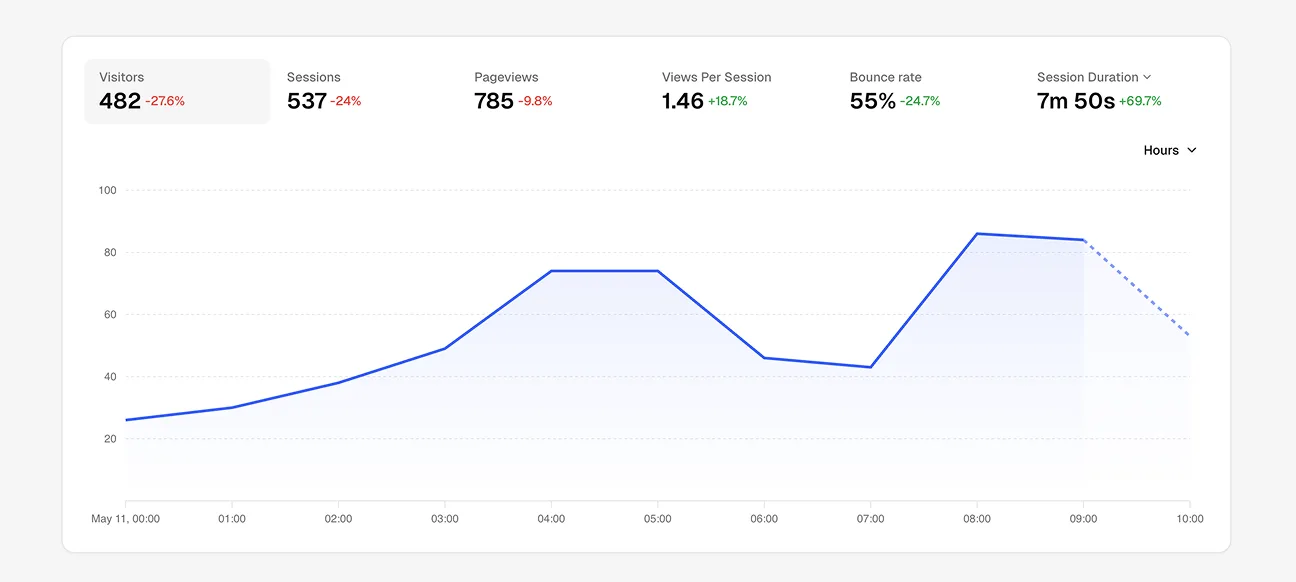
Switching the chart metric
Every KPI card is also a chart selector. Click any card and the main chart re-renders with that metric. The active card stays highlighted.
You can chart one metric at a time. To compare two metrics, switch between them.
Changing the timeframe
Statable picks a sensible bucket from the date range:
- Realtime: minute-level (last 30 minutes)
- Today / Yesterday: hourly
- Last 7 days / Last 30 days: daily
- Last 90 days / Last 12 months: weekly
- All Time: monthly
Override it with the timeframe selector in the chart's top-right corner.
Realtime
Click the Current visitors badge, or pick Realtime from the date range presets (shortcut: R). Realtime shows a 30-minute window with minute-level resolution and auto-refreshes every few seconds. Filters and reports work the same way, so you can see which pages live visitors are reading right now.
For metric definitions, see Sessions, Pageviews, and the rest of the basics encyclopedia.
Public dashboards
Share a read-only version of this dashboard with a link, no account needed. Enable it under Site settings → General → Public Access. Full setup, privacy notes, and limits in Public dashboard & sharing.
Where to go next
- Top stats: how each KPI is calculated.
- Reports: the five tabbed report groups.
- Filters & segmentation: 23 built-in filters, custom-property filters, 8 operators, URL state.
- Date ranges & Compare: presets, shortcuts, period-vs-period mode.
- Public dashboard & sharing: share a read-only view with a link.
Keyboard shortcuts
Most actions have a single-letter shortcut: R for Realtime, T for Today, C to toggle Compare, U for Custom Range. Press ? for the full cheat sheet.
Ready to take control of your web analytics? Try Statable free for 30 days. No credit card required, full feature access, built for GDPR. Start your free trial or view a live demo.