Funnels
A funnel measures how visitors move through an ordered sequence of steps and shows where they drop off before converting. Define the steps of a conversion path, and Statable reports how many visitors reach each one.
Funnels live on the Funnels tab in the dashboard. Anyone who can view the dashboard, including public and shared-dashboard visitors, can see your funnels. Only people who can manage the site can create, edit, or delete them.
Build a funnel
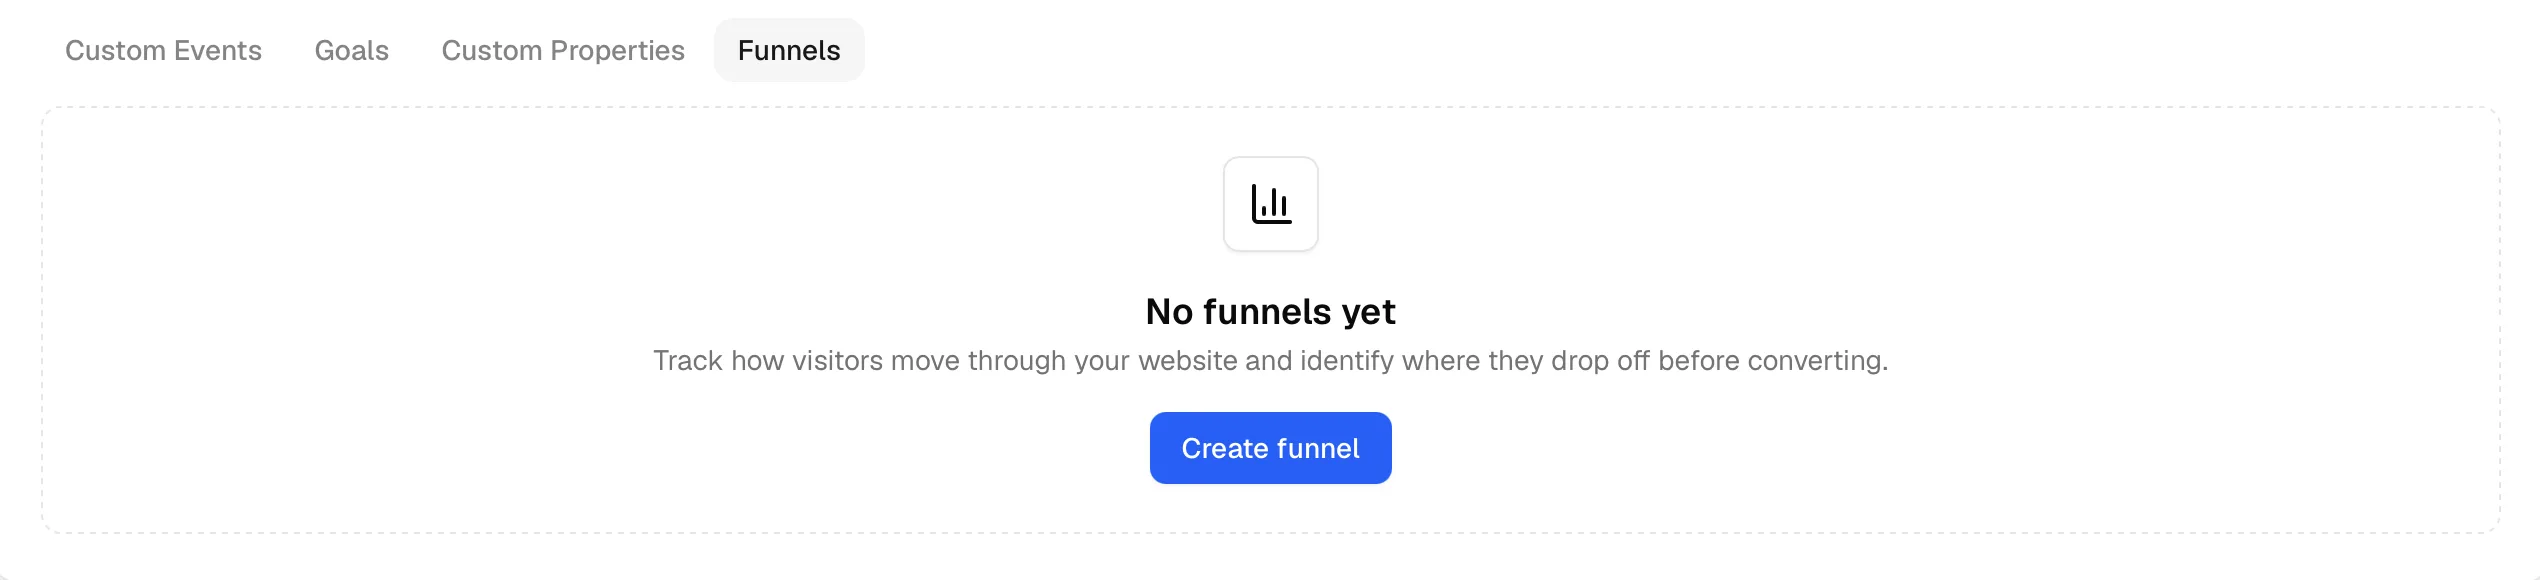
On the Funnels tab, click Create funnel and give it a name.
Add its steps, then click Add funnel.
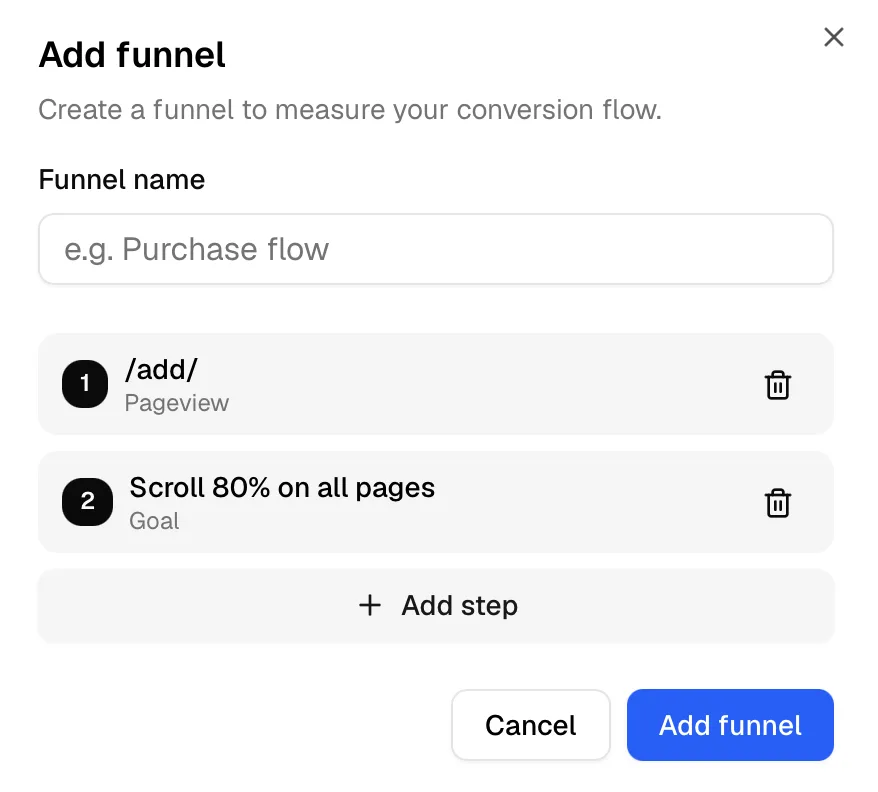
A funnel has 2 to 8 steps. Each step is one of five kinds:
| Step | What it matches | Position |
|---|---|---|
| Pageview | A page path | Any |
| Entry Page | The page a visit started on | First step only |
| Exit Page | The page a visit ended on | Last step only |
| Event | A custom event, optionally filtered by a property | Any |
| Goal | One of your configured goals | Any |
- Page-based steps (Pageview, Entry Page, Exit Page) match a path with an operator: equals, begins with, contains, or regex.
- Event steps take an event name, plus an optional property key and value.
- Goal steps pick from your existing goals (how goals are created).
Add steps from the Add step menu. Entry Page is only valid as the first step, Exit Page only as the last.
Examples
A few funnels assembled from the step kinds above:
- Trial signup: Entry Page
/→ Pageview/pricing→ GoalSign up. Shows where pricing visitors drop before creating an account. - Checkout: Pageview
/cart→ EventAdd shipping→ GoalPurchase. Shows how many carts make it to payment. - Content to lead: Entry Page
/blog→ Pageview/newsletter→ EventNewsletter signup. Shows how many blog readers reach the signup page and subscribe.
Read the results
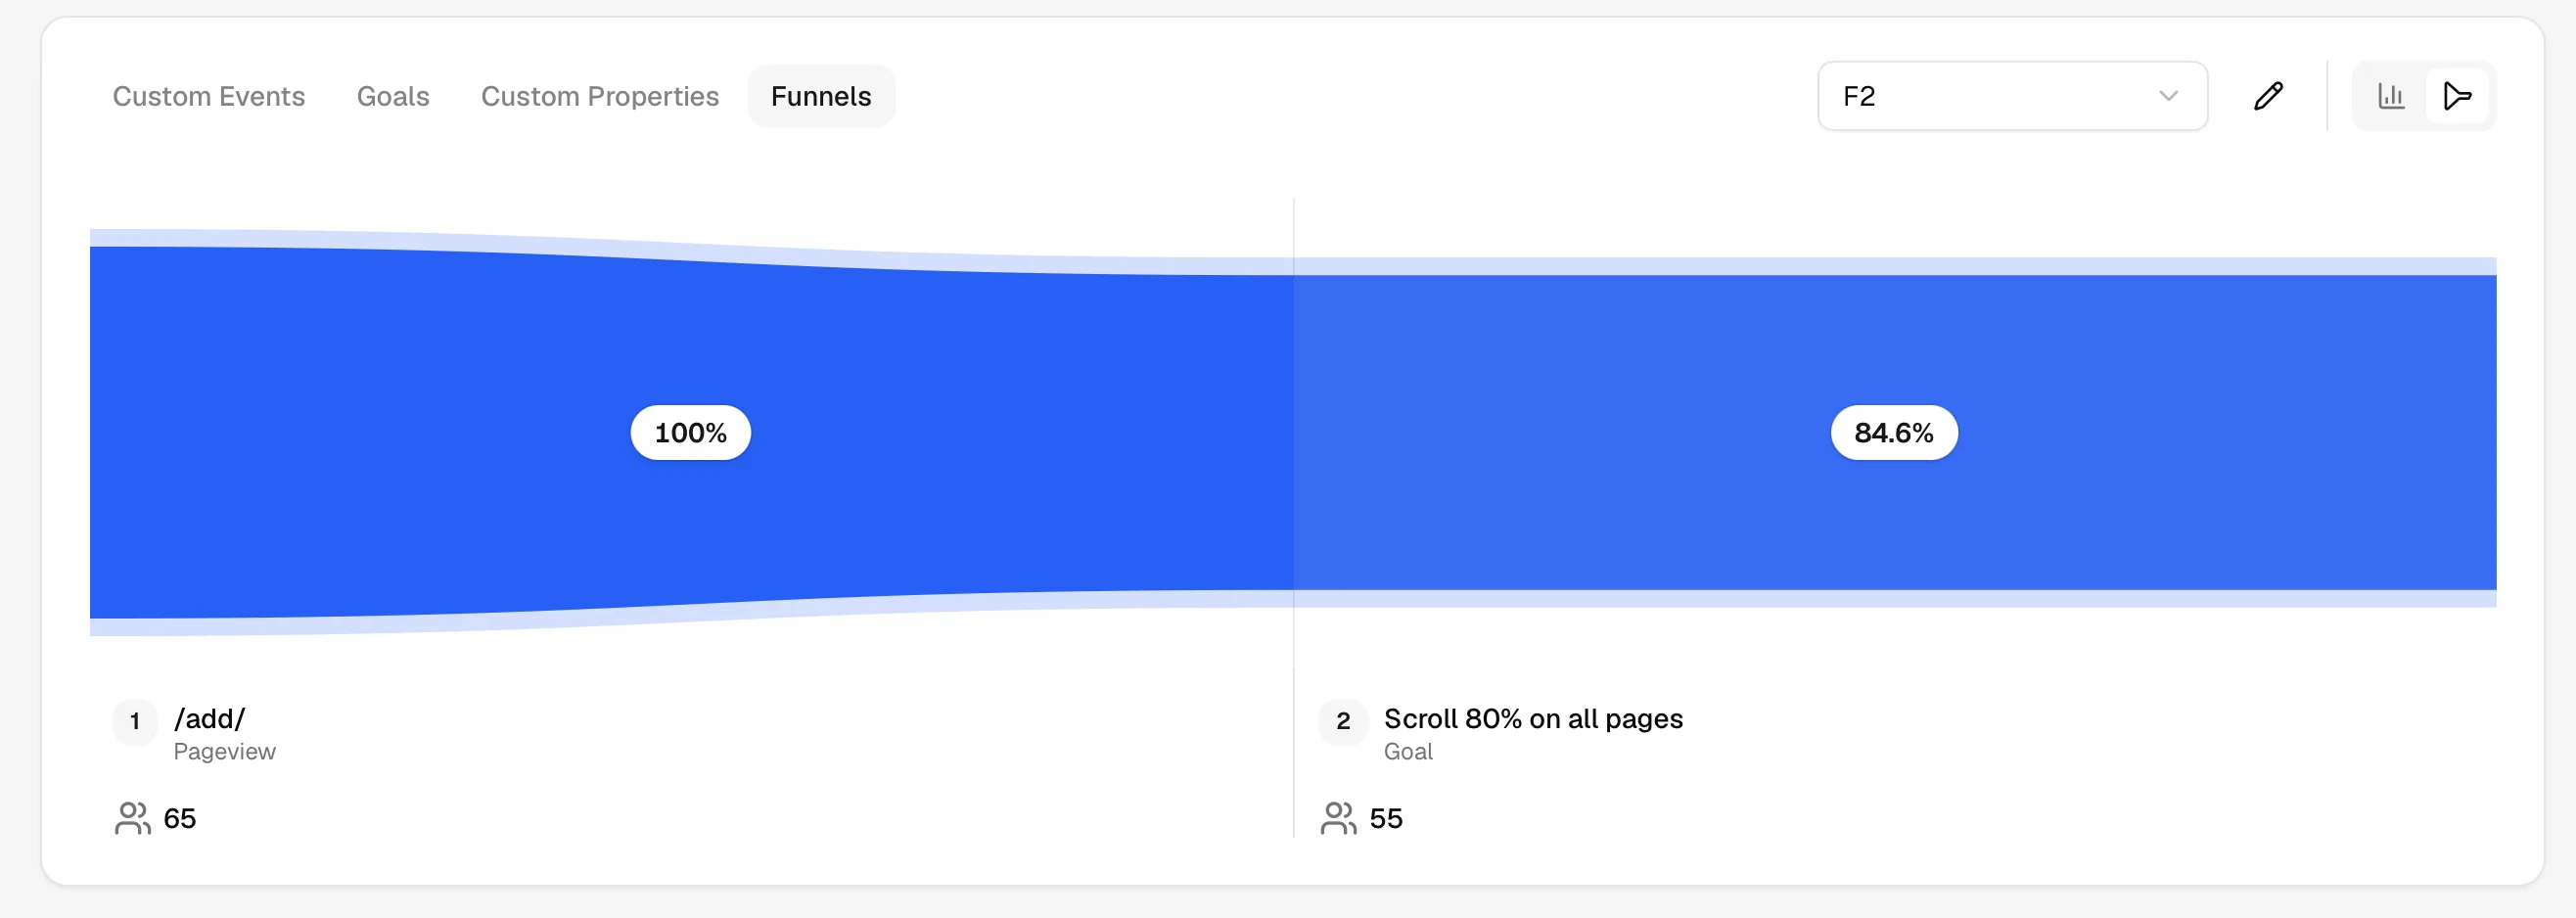
Pick a funnel from the selector at the top of the tab to see its chart. Each step reports:
- Visitors who reached that step.
- Conversion rate: the share of everyone who entered the funnel (reached step 1) that made it this far.
- Drop-off: visitors lost since the previous step.
The site-wide conversion rate is calculated differently: converting visitors divided by all visitors.
Switch between two views with the chart tabs:
- Bar chart: one bar per step, sized by visitor count.
- Flow chart: a connected view that highlights where visitors fall out between steps.
Steps are counted in order within a one-day window. A visitor reaches step 3 only after reaching steps 1 and 2 before it, on the same day. Anything else they do in between is ignored and does not break the funnel.
Edit or delete
To change a funnel, select it and click Edit funnel in the toolbar. Adjust its name or steps, then click Save changes. To remove it, click Delete in the same dialog and confirm in the Delete funnel? prompt.
Ready to take control of your web analytics? Try Statable free for 30 days. No credit card required, full feature access, built for GDPR. Start your free trial or view a live demo.