
Simple Web Analytics
Web Analytics That's Actually Easy To Understand
See exactly how people use your site, all from one clean dashboard. Privacy-first and cookie-free.
No card required • 30 days trial • Based in Europe
 United States
 Germany
 Brazil
 Belgium
 Canada
 Ukraine
 Netherlands
 Poland
 France
 Spain
Spain Chrome
 Firefox
 Safari
 Mobile Safari
 Edge
Edge Opera
Opera Brave
Brave Samsung Internet
 Yandex Browser
 DuckDuckGo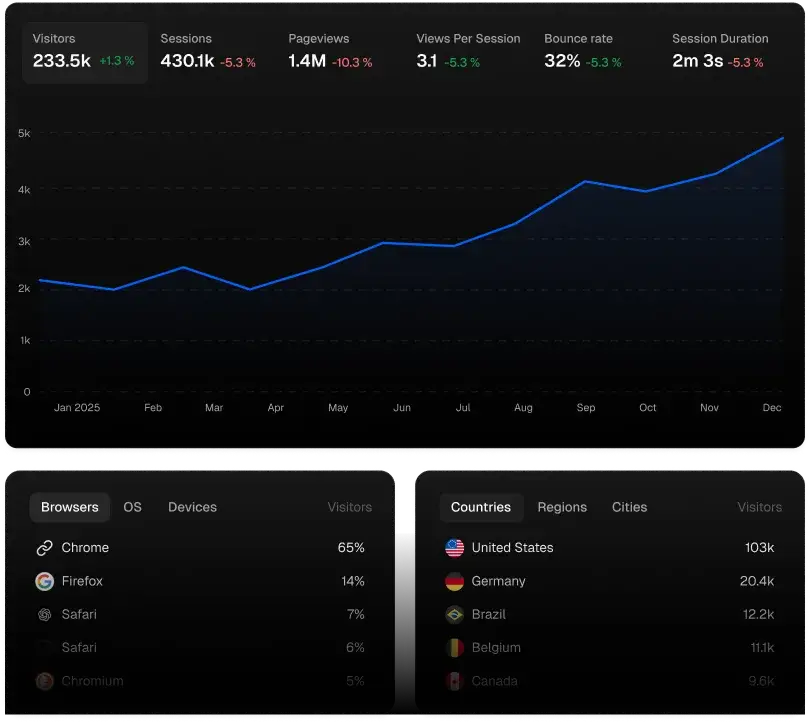
30 Sec To Install
One line of code, no Tag Manager, no setup.
0 Cookies
Cookieless analytics writes nothing to the visitor's device, so there is usually no consent banner to add for analytics.
Lightweight Script
About 2 KB over the wire, or under 1 KB with the Nano bundle. It is deferred, so it never blocks your page render.
Our Vision
Everything On One Screen. Nothing You Don't Need.
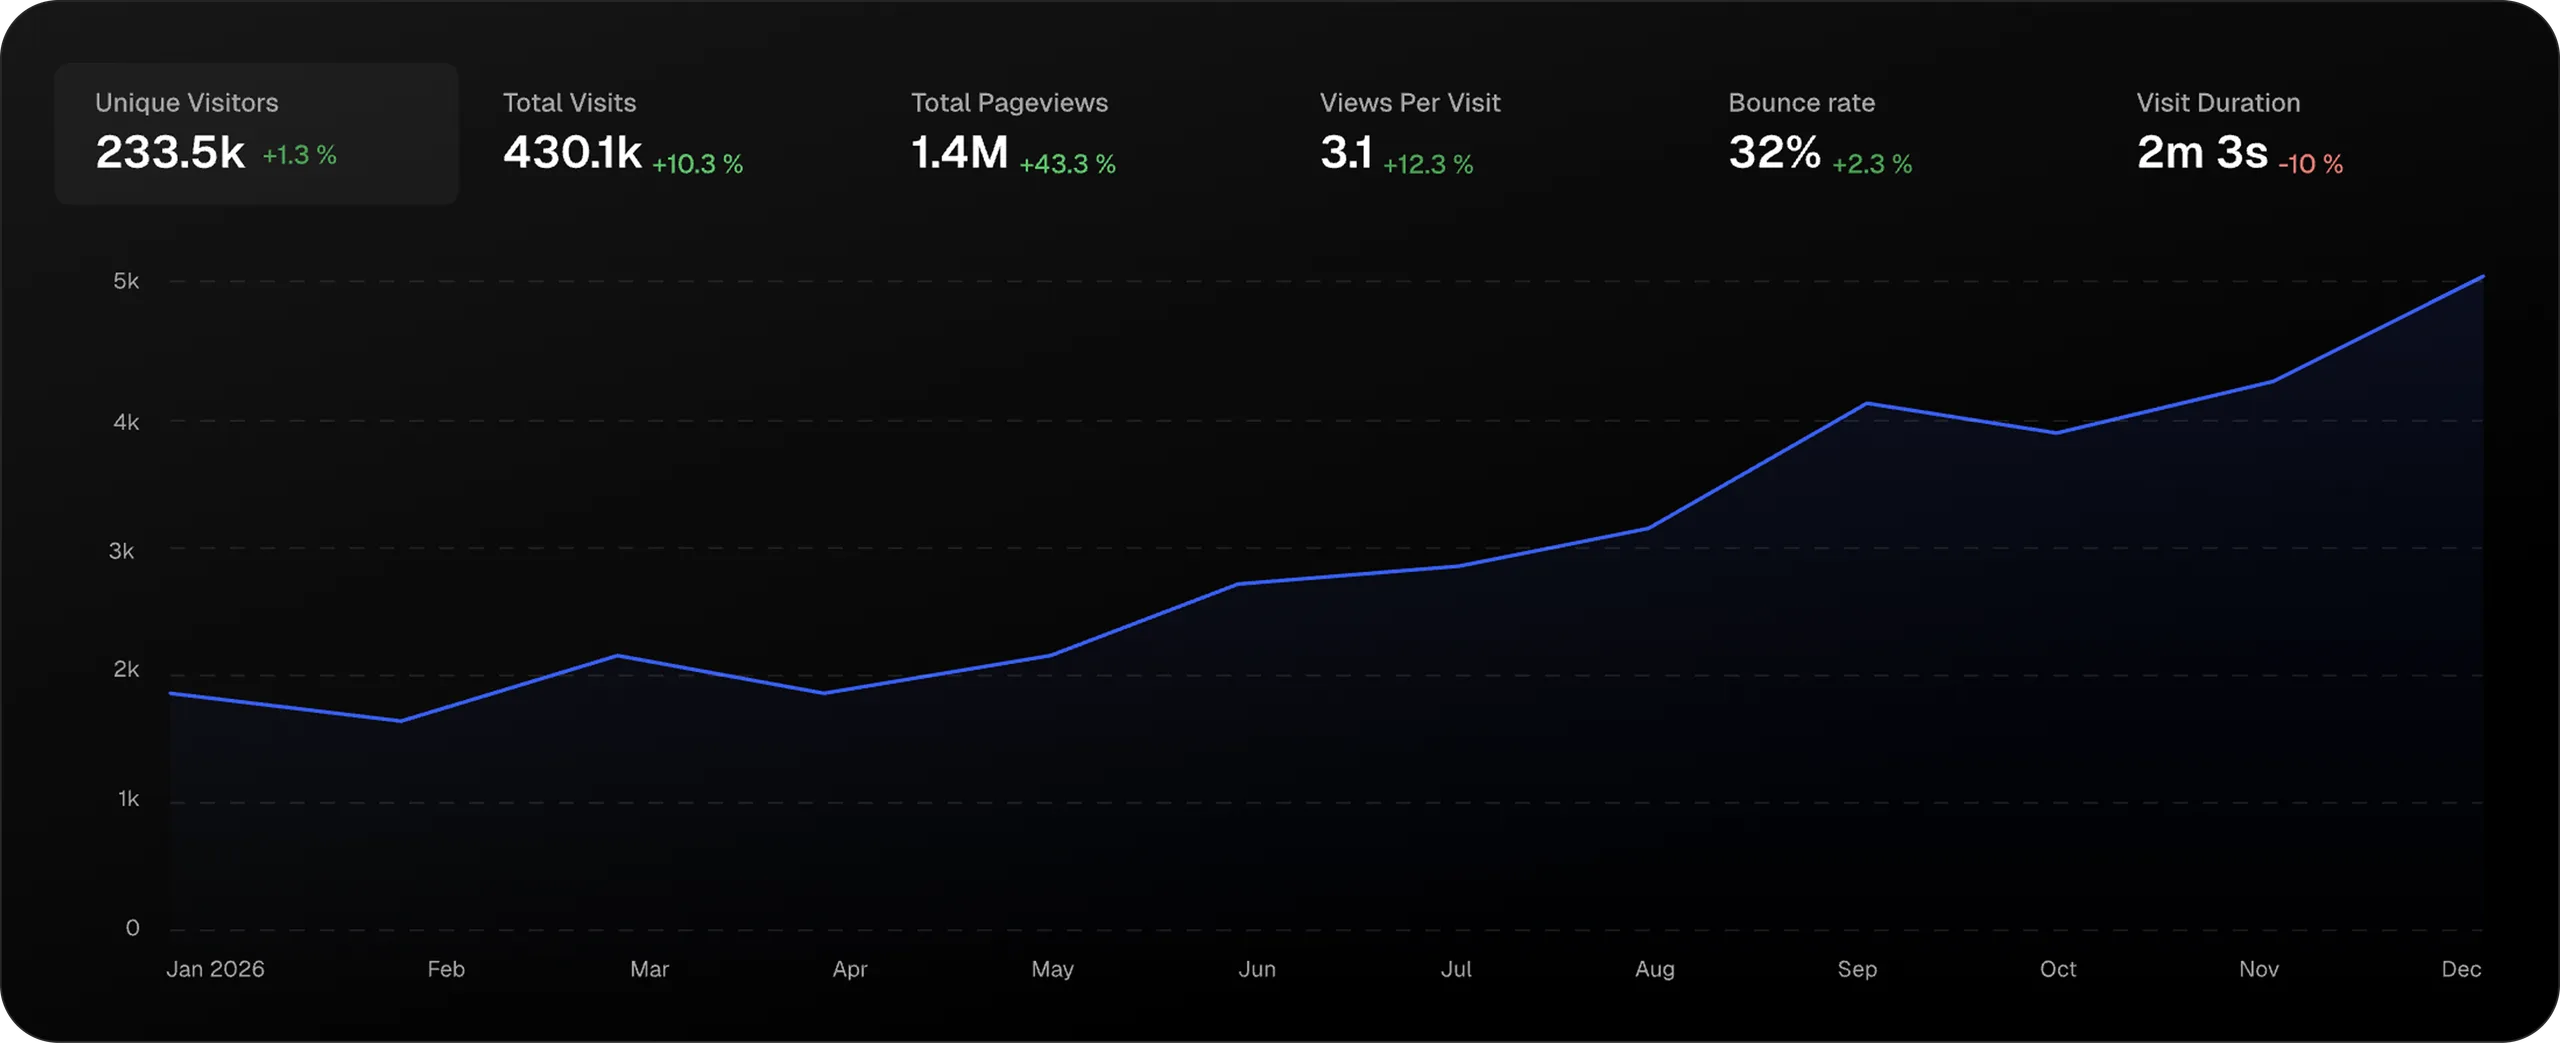
The moment you log in, your traffic is right there: who's visiting, the trend, and where they came from. No menu diving, no reports to build.
One Simple Screen
Your key metrics stay up top. No digging through 150 reports.
Plain Language
Everything's named the way you'd actually say it, so the dashboard feels intuitive from your first visit.
Click Anything To Filter
By page or source. No query builder, no setup.
Our Principles
Easy Web Analytics. Full Visibility.
Most simple website analytics tools achieve their clean interface by removing the features you actually need. What you get is basic web analytics: a single big number for visitors, a country list, and very little else. Then the next time a stakeholder asks where conversions are coming from, you reach back for Google Analytics.
Statable takes the other direction. It is easy to understand because every report fits on one page. You still get custom events, UTM campaign tracking, conversion goals, country and device breakdowns, bot filtering and all available history imported from GA4, in a simple dashboard you can read in fifteen seconds. The interface stays simple, and nothing is hidden from you.
Real-Time Visitors
A live counter sits on every report, so there is no separate Realtime tab to open. What you see is happening right now.
Goals And Conversions
Mark any pageview or event as a goal. See conversion rate by source, country and device all on one page. No analytics specialist required.
Custom Events
Track button clicks, form completions, file downloads or anything else with one JavaScript call. No schema to register up front, no tag manager.
Bot Filtering
On by default. Known bots are filtered before they reach your dashboard. No phantom traffic, no manual exclusion rules, no scrubbing in spreadsheets.
UTM Campaigns
Source, medium, campaign and content show up as their own columns in every report. No GA4 property configuration, no separate exploration view.
Embed Widgets
Live Users, Top Countries, Visitor Map and 3D Globe. One-line embed on any public page. Share live numbers without sharing the dashboard.
Our Principles
Private By Default. Nothing To Configure
Statable is private by design, and that keeps things simple for everyone.
Statable is private by design, and that keeps things simple for everyone.
Minimal, pseudonymous data means a much shorter review for your legal team.
Most of the compliance work that comes bundled with analytics, starting with the consent banner, simply isn't here.
Our Principles
How We Count Visitors Without Tracking Them
You never have to set any of this up. But here is how it works, if you're curious. Each visit gets a pseudonymous ID from a keyed hash. Four things go in: your site's id, the visitor's user agent, their IP address and today's date. The key is a secret that never leaves our servers. From that recipe come four deliberate properties:
- The IP address is only used to build the hash. It is never stored.
- Because the date is one of the inputs, each ID lasts a single day. Tomorrow, the same person is counted fresh.
- Because your site's id is one of them, the same person on another site is never linked back to yours.
- Because the key is secret, nobody who knows a visitor's IP and browser can work out which ID they produced.
You still get real, distinct daily visitor counts. They are pseudonymous from the start. The whole approach is designed around GDPR and EU privacy rules from the first line of code.
Our Principles
Install
Sign Up Free
Your email, or Google or GitHub. No password to pick, no credit card, no plan picker, no onboarding interview. Your 30-day trial starts automatically, every feature unlocked.
Paste One Line Of Code
Copy a single <script> tag and drop it before </head>. No Tag Manager, no consent variable, no SDK.
See Live Data
Refresh your dashboard. Live visitors are already counted, and top sources, pages and countries fill in within the first minute of traffic.
Switch Without Starting From Zero.
What You Keep
You don't lose your history when you switch. Statable imports all available history from GA4 through a quick Google sign-in: pageviews, sources, top pages, countries and devices, day by day. Your year-over-year charts work from the first day, with no CSV exports and no taxonomy to rebuild.
Why It's Different
Most simple analytics tools either skip migration entirely or hand you a spreadsheet to upload. Statable treats leaving GA4 as part of the setup, because switching is exactly when complexity hurts most. The whole import is three short steps and a few clicks.
Three Steps To Import
Step 1
Open Import, Sign In With Google
In Site Settings, open the Import tab and click "Import from GA". You're routed to Google's consent screen. Statable requests a read-only scope on your GA4 account, never your password and never other Google services.
Step 2
Pick The GA4 Property And Range
Choose the property behind your site and how far back to pull. All available history is the default, and you can narrow it to a shorter window if you only need recent data.
Step 3
Your History Populates
Daily aggregates back-fill the historical dashboard in minutes. Your year-over-year charts work the next time you open the page.
Turn Your Numbers Into Social Proof
Your dashboard stays private by default. But some numbers are worth putting on display.
These four widgets drop your live stats onto any page you publish:
- Homepage
- Landing page
- Status page
- About page
Each is one line of code, stays in sync with your dashboard automatically, and takes its theme, size and colour from your settings. No design ticket required.
Live Users
A live look at who's on your site right now: the current count, active visitors by country over the last 30 minutes, and a real-time graph of the trend. The “reading this now” badge, with the full picture behind it.
Globe
The eye-catching version of the map: an animated 3D globe with a pin for each visitor. Built for a flagship landing page where you want a little wow. Loads lazily and degrades gracefully on low-power devices.
Map
A clean world map with a dot for every visitor's city. Drop it in a homepage hero to show at a glance that people are reading from everywhere.
Top Countries
A ranked list of where your audience is, with flags, share and live counts. The compact, text-friendly option for an About page or anywhere space is tight.
FAQ
Frequently Asked Questions
What's the difference between Statable and Plausible?
They share the same philosophy: simple, privacy-first website analytics on a single page, with no cookies. Two things set Statable apart. First, embeddable widgets: a live visitor map, a 3D globe, a top-countries list and a live-users counter you can drop on your own pages, which Plausible doesn't offer. Second, a free tier for educational (.edu) sites and projects on GitHub or GitLab Pages, where Plausible is paid-only.
Does it work with WordPress, Webflow and Next.js?
Yes. Statable works anywhere Google Analytics would: if you can add one line of code before </head>, you can run Statable. WordPress, Webflow, Next.js, Nuxt, Vue, Ghost, Squarespace and plain HTML all have a place to paste the snippet, and the docs cover the common ones. WordPress has an official Statable plugin, so there is nothing to paste there at all.
Will I need a cookie banner?
Not for Statable itself. It sets no cookies, writes nothing to localStorage, and stores no identifier on a visitor's device, which is what a cookie-consent banner exists to cover. Your visitor counts come from a short-lived signal that resets every 24 hours, is never linked to a profile, and can't be traced back to an individual: the IP address used to generate it is discarded on the fly and never stored.
That's why teams typically run Statable without a dedicated analytics consent banner, the same way other cookieless tools are used. Consent law in the EU keeps evolving and depends on the rest of your stack, so the final call is yours. You may also still need a banner for other tools you run, like chat widgets, ad platforms, social network widgets, third-party comment systems or A/B testing, even when Statable doesn't add one.
Is it really simple if I'm not a developer?
Yes. The hardest non-developer step is finding where to paste the script tag, and the documentation covers that for the common platforms. WordPress users can skip that step entirely: the official Statable plugin installs from the plugin directory and sets the script up for you. Webflow users open Project Settings and paste into the "Inside head tag" field. Squarespace, Ghost, Notion-published sites and most modern site builders have an equivalent "custom code in head" option. Once installed, the dashboard has no settings to misconfigure. Every visitor is counted automatically.
Is the free tier really free?
Yes, with a defined scope. Statable's free tier covers educational sites with a .edu domain, projects hosted on GitHub Pages and projects hosted on GitLab Pages. The free version is the full analytics product with the simple dashboard, custom events, UTM tracking, goals and country breakdowns. In return, the free-tier installation automatically displays a small "Powered by Statable" attribution link in the footer of your site. Commercial sites and personal domains start on the 30-day trial with every paid feature unlocked and no credit card required.
What kind of websites is Statable a good fit for?
Statable is built for sites where someone needs to read the dashboard quickly and act on it the same day: content publications, marketing sites, documentation sites, indie SaaS homepages, small business sites, agency client portfolios, conference and event sites, newsletters with web archives, and side projects you want to share live numbers about.
It is intentionally a website analytics tool, not a product analytics tool. Multi-step funnels are there, so you can see where visitors drop off between pages and events, but there are no cohort retention curves, no session replay and no feature-flag experiments. If your need is "how did our last campaign do and what page is winning right now," Statable fits. If your need is "analyse user journeys across our SaaS app over six months," Mixpanel, PostHog and Amplitude are the right category.
What does easy website analytics mean exactly?
Three things: easy to install (a single line of code, no Tag Manager), easy to understand (one page, no jargon, no specialist training), and easy to migrate to (a guided GA4 import via Google sign-in).
What it does not mean is fewer features. Minimalist web analytics usually earns its clean interface by dropping custom events and UTM tracking. Here those are core, and they are simple to configure. Only the interface is minimal.