Conversion tracking
Once conversion goals are configured, every dashboard can be sliced by completion. Conversion tracking turns raw traffic into answers: did this campaign, channel, or page actually drive the outcome we care about?
The Goals report
Open the Goals tab. Each row is one goal, with three numbers:
- Conversions: total times the goal fired in the date range.
- Unique conversions: distinct sessions that completed the goal at least once.
- Conversion rate: unique conversions divided by total sessions, as a percentage.
For scroll depth goals, Conversions shows a dash. They're counted once per session, so only Unique conversions and Conversion rate apply. Pageview and custom event goals show all three.
The denominator is all sessions in the current filter scope, not page-specific traffic. For a page-specific rate ("what percentage of /pricing visitors signed up?"), apply a page filter first.
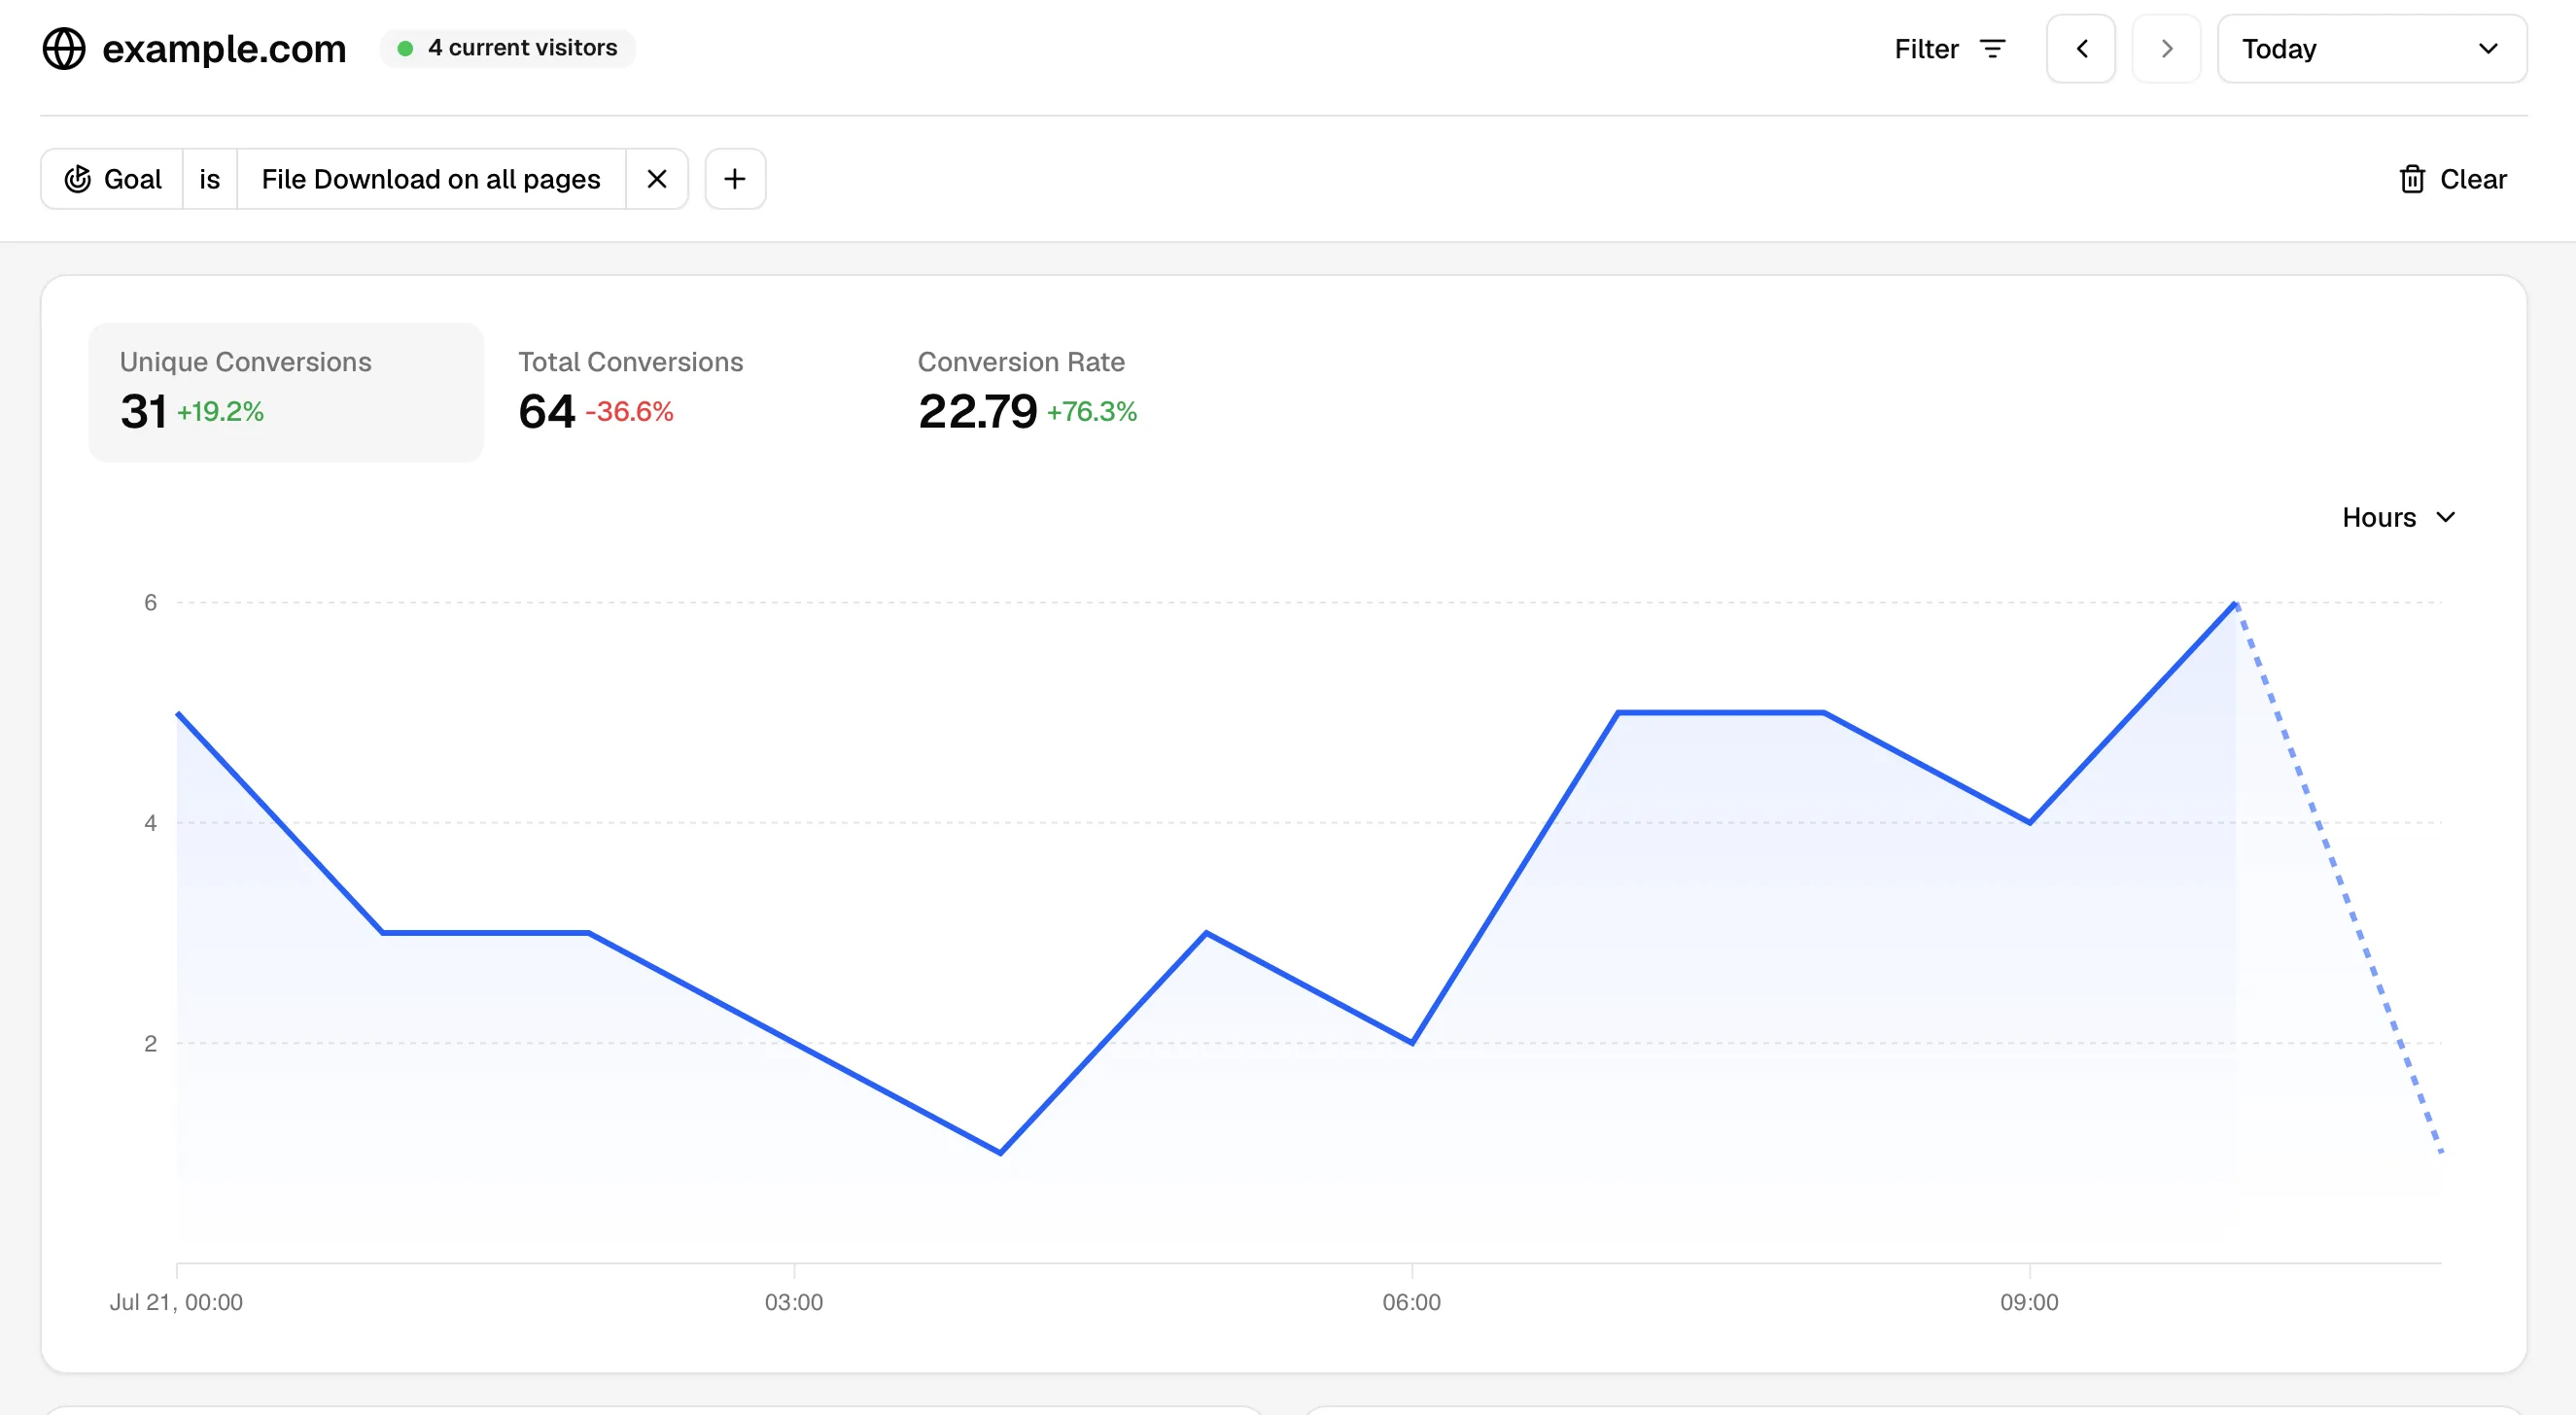
Filter by goal
Click any goal in the report to scope every widget on the dashboard to sessions that completed it. Pageviews, sources, devices, countries, durations now describe the converters, not your traffic at large.
This is the most useful thing goals do. Questions it answers in seconds:
- Which traffic source brings the highest-converting visitors? Click the goal, read Sources.
- Which landing page starts the best converting sessions? Click the goal, read Top Pages sorted by entries.
- Which country / device / browser converts disproportionately well? Click the goal, read each widget.
Remove the filter chip at the top to restore the full-traffic view.
Stacking with filters
Goal filters stack with everything in Filters and segments. Useful combinations:
Goal: Article Read (75% scroll)
Page: /blog/*
Device: mobile
→ Mobile reading completion on the blog
Compare rates across segments, not absolute counts. Two channels with identical conversion volumes can have wildly different rates. The rate is what tells you which channel scales.
Real-time goals
Realtime mode shows goals over a rolling 30-minute window. Goal completions appear as they happen, alongside live pageviews and visitor counts.
Use realtime goals to validate that a deploy didn't break tracking, a campaign just went live and is firing, or a fix actually landed in production.
Synthetic goals (event filters)
Convert any event into a one-off goal without creating it in Site settings → Goals. Apply an event-name filter from the dashboard:
When an event filter is the only filter in scope, Statable treats it as a synthetic goal. The dashboard shows a conversion rate against total sessions, exactly as if you'd defined a Custom Event goal. The fastest way to spot-check a new event without committing to a permanent goal.
If you keep reapplying the same event filter, promote it to a real goal in Site settings → Goals so it persists and is available to teammates.
Worked example: best channel for signups
Question: which acquisition channel produces the highest signup rate?
- Define a Custom Event goal
Sign Up(one-time setup). - Select your time range. 30 days is a sensible default.
- Click the
Sign Upgoal in the Goals report. - Read the Sources widget. It shows visit volume per source for sessions that converted.
- Click each source one at a time. The conversion rate at the top updates to reflect that source's signup rate.
Channels with high traffic but low conversion rate are unloved by your funnel. Fix the landing pages or stop spending there. Low-traffic, high-rate channels are scaling opportunities.
Next steps
- Define more goals
- Add context to events: Custom properties
- Combine goals with deeper segmentation: Filters and segments
Ready to take control of your web analytics? Try Statable free for 30 days. No credit card required, full feature access, built for GDPR. Start your free trial or view a live demo.